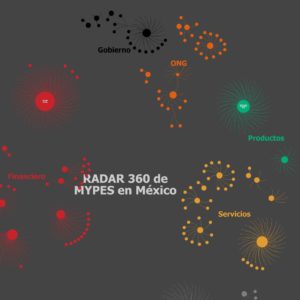
The MSE Radar interactive maps displayed the broad universe of institutional sectors and the micro, small, and medium-sized enterprise (MSEs) subsegments that make up the MSE ecosystem. They were created with the institutions that responded to the MSE Radar survey and were complemented with listings of companies belonging to various institutional sectors and subsectors. The maps highlight the logos of the institutions that have responded to the survey to date.
All institutions in the ecosystem that chose to be part the MSE Radar by responding to the survey appeared in the interactive maps with their corresponding logos.
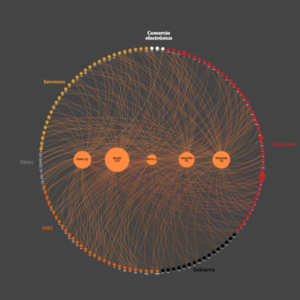
This map shows the diverse sectors and subsectors that comprise the MSE ecosystem of actors. It includes participants and non-participants in the survey and highlights the logos of institutions that responded to the survey.
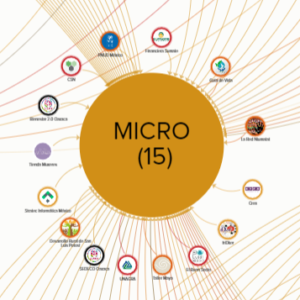
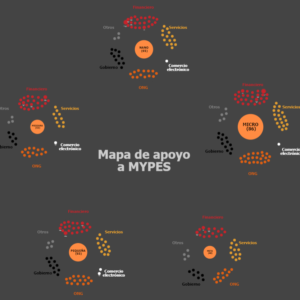
These three maps show the interaction of ecosystem actors with various subsegments of micro and small enterprises (MSEs) during 2022. They only include institutions that responded to the MSE Radar survey.
Each map provides a different visualization and enables the observation of the interaction by individual institutions with the subsegments they serve or, alternatively, all institutions that interact with a particular segment. By hovering the cursor over an institution or a subsegment, the interaction between each can be viewed.
Showcase the important role that your institution plays in the business development ecosystem of Mexico by being part of the MSE Radar!