Tracking Churn to get to Profitability
Sokowatch’s experience integrating a retention dashboard
At Catalyst Fund, we have helped 20 inclusive fintech startups move from idea to prototype, to the product, to profitability. It may surprise some to learn that the indicator we watch most closely is user retention or churn.
Retention measures the percentage of active users over time and tells us whether customers are sticking around or peeling off to find other solutions or products.
Retention gives us a snapshot of how well a startup is doing at any given moment, and tracking its evolution over time shows us how well the startup is progressing along its product-market fit journey. Product-market fit (PMF) is a methodology to help startups get from an idea to a viable product that is ready for market/scale. Many startups fail along this journey because they do not achieve PMF before investing in scale; they misinterpret revenue growth as evidence for PMF and declare victory too quickly, ignoring problems with churn. Time and time again, we have seen that product-market fit — as demonstrated by low churn — drives startup success and that its absence is lurking behind almost every failure.
Tracking Retention Curves
The graph below illustrates the retention curve for an individual cohort (a group of customers with a shared characteristic, for example, their month of activation). It visualizes retention by showing the percentage of users who return over time on the Y-axis, and time since first use on the X-axis (typically measured in weeks or months). By tracking the retention curve over time across cohorts, a startup can measure its progress towards PMF.
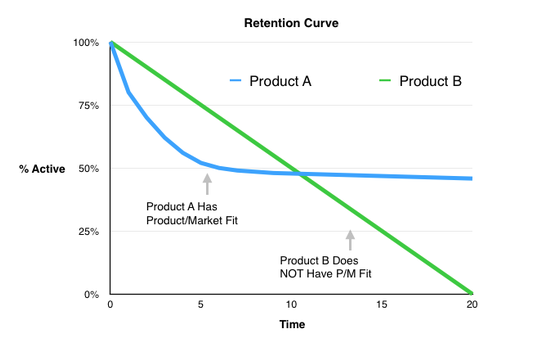
A startup should aim for a retention curve with the shape of the blue line. It has a downward slope in the beginning because we do not expect that 100 percent of customers will return to purchase again, and because we expect a delay between purchases. The initial downwards slope shows that it takes some time for an initial group of customers to convert into a stable base of users who can drive sustainable medium- to long-term revenue. The flat part of the line shows that, after an initial drop off, customers return and the customer base stabilizes.
While the blue line is the goal, it is normal for startups to have retention curves that look like the green line early in their PMF journey. At the beginning, startups are focused on growing their user base and acquiring customers. They tend to spend less energy on refining the product offering, finding the right commercial offer, and establishing the operational model, so they tend to lose customers after the first sale. Generally, this initial acquisition ramp-up is messy since the company is a new machine that is evolving on many axes simultaneously. As a result, indicators are noisy, meaning that it is difficult to identify and diagnose problems with retention. However, as startups refine their product, they need to shift their attention so that their retention curves improve as customers become loyal users.
Improving Customer Retention at Sokowatch
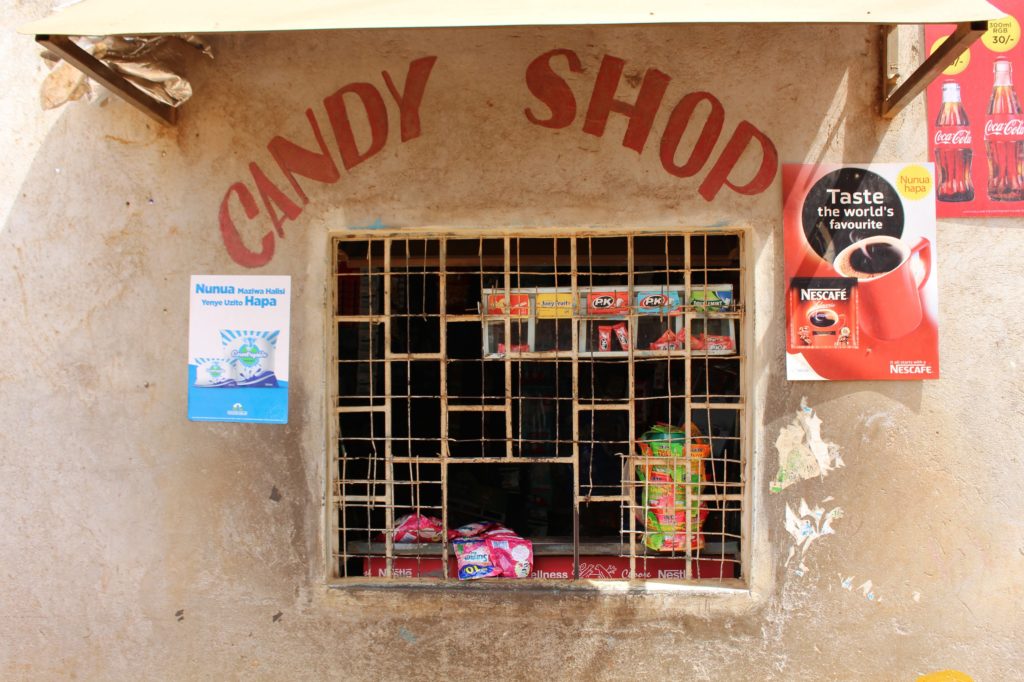
Catalyst Fund portfolio company Sokowatch is an e-commerce platform that sells products and services to informal retailers across emerging markets in East Africa. When Sokowatch joined Catalyst Fund, it was experiencing moderate levels of churn; 20 percent of new users only purchased one time. These shopkeepers would purchase on the platform, but they weren’t becoming regular customers.
It was initially difficult to identify the retention problem because growth in sales to new customers was masking it. Sokowatch was acquiring on average 300 new users every month. The number of monthly active users almost tripled between 2017 and 2018, and existing customers were spending more each time they purchased, driving consistent growth in revenue per user each month. Every week and month brought a new record in sales.
Unfortunately, even with this impressive growth in sales, a significant number of customers were not returning. The team needed to understand how to move these customers from making one-time purchases to becoming loyal users, and to understand the causes of drop-off.
When considering how to improve the product, it was clear that the competition was stiff. Other formal and informal suppliers offered greater product variety, delivery services, competitive prices, and lines of credit, so the list of possible ways forward was long. Catalyst Fund conducted a nano project to understand what was driving churn/drop-off. The team conducted in-person interviews and ethnographic research, observing actual Sokowatch customers making purchases and shadowing Sokowatch agents as they worked. Based on the nano, the team identified two key opportunities and designed relevant solutions that are now being testing.
In-Kind Credit
In the interviews, 50 percent of users mentioned they got credit from other suppliers and highlighted the lack of payment flexibility as a key reason for not ordering from Sokowatch. From the point of view of suppliers that are trying to grow their market share and outrun competitors, such financing is a competitive value-added service for attracting merchants.
In response, Sokowatch is piloting an in-kind credit solution through another BFA Global’s program, FIBR. The solution hasn’t yet been scaled up to their entire database, but the impact on retention looks promising since half of those that start purchasing on credit are becoming weekly borrowers. These customers tend to frequent Sokowatch at least one day a week. They pay back the previous week’s purchases and make purchases for the next week. The merchant buys on credit, sells those goods to make a profit, and then comes back to restock (on credit), creating a virtuous cycle of retention.
Agent Incentives
The nano research also revealed that for companies like Sokowatch — whose users expect them to show up every day to build personal relationships — having motivated and incentivized agents is key to success. Previously, Sokowatch agents had monthly sales targets based only on revenue (total amount sold) regardless of the number of shops they visited or how loyal those shops were. There was no incentive for agents to make the effort to build relationships with shopkeepers. They were incentivized to just get out there and sell as much as they could. The team also found that morale among the agents was low since these sales targets were hard to reach and not worth the effort financially.
In response, Sokowatch listened to their agents and changed the commission scheme to add a month-to-month retention component. Now, if 95 percent of the shops that purchased during last month purchase again, agents earn an extra monthly bonus. Preliminary results show that the new incentive schema is improving retention, and agents seem more motivated.
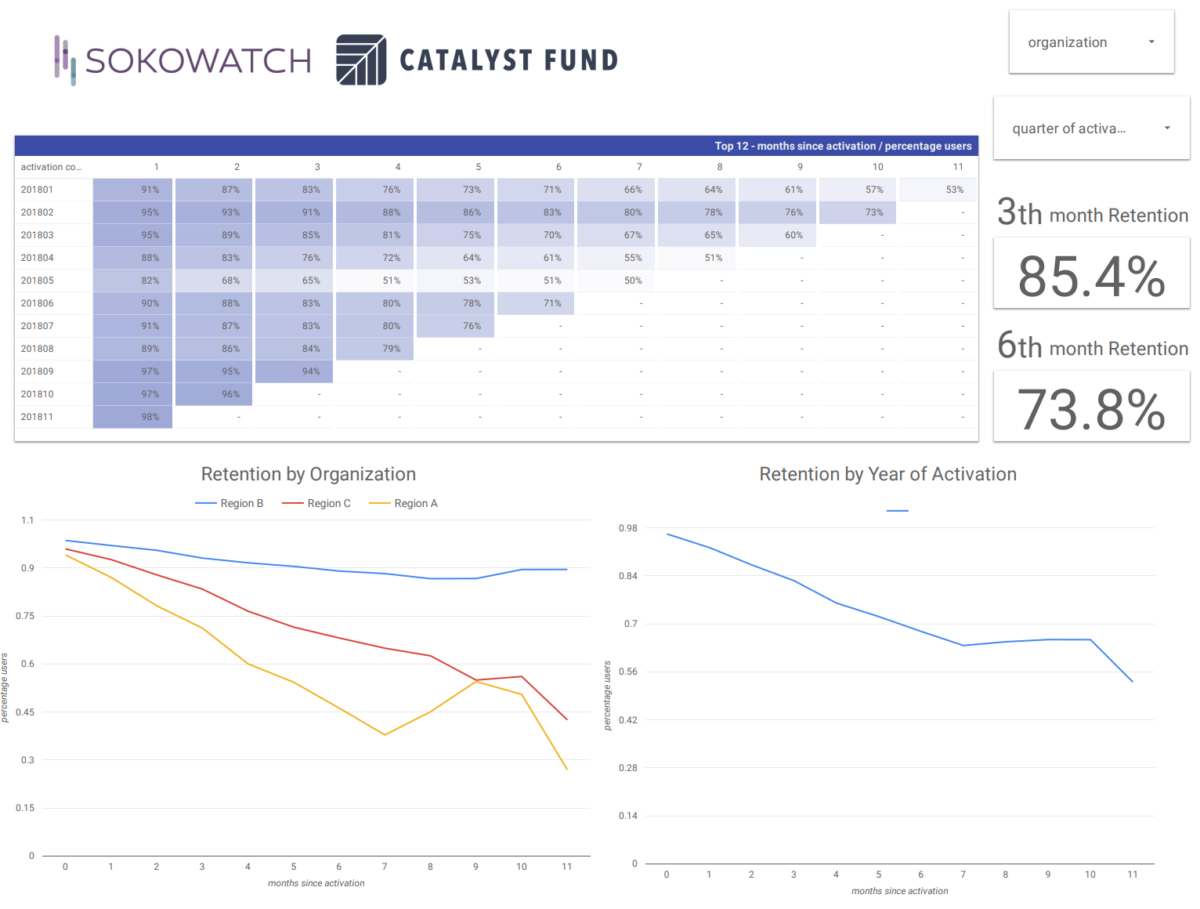
Management Tools: Retention Dashboard
To help Sokowatch focus on retention, Catalyst Fund used Google Data Studio to create a real-time dashboard to analyze the progress of new cohorts, create projections, and analyze usage over time. The dashboard has a set of filters to break the data down into digestible pieces and to allow product managers to drill down into the details.

Importantly, the dashboard gives Sokowatch the ability to constantly evaluate the shape and changes in its retention curve. With the retention curve always in their sight, they can ensure they are progressing toward product-market fit and ultimately, scale.
Ultimately, retention isn’t a one-time snapshot. Startups should keep retention at the center of their business metrics along with growth, average revenue per user (ARPU), and other traditional profitability measures.
Startups need to diagnose problems with retention as soon as possible to identify problems with new cohorts or with new product features. Without attention to retention, progress towards PMF may stall or startups may scale prematurely, particularly in noisy environments where other positive metrics can hide retention problems.