
An essential aspect of achieving product-market fit (PMF) is defining it so that you know when you get there! However, defining those milestones and then reliably measuring progress against them isn’t a trivial task. Within the same startup, each team member might have a different opinion of what PMF means for them, and it is easy to get distracted by vanity metrics.
Across our engagements, we have found that customer retention is the single strongest indicator of product-market fit. While it is easy to get distracted by numbers of new customers or even revenue, the extent to which customers stick around tells you how much they love your product, and whether they will recommend it to other people (this can be measured using metrics like NPS) thus providing valuable information about the long-term prospects of your business. As such, our view is that retention is the core indicator of PMF – whether you have 50 clients or 500,000. If customers find value in your product or service, they will come back to you over time, and this proves you have built something people want.
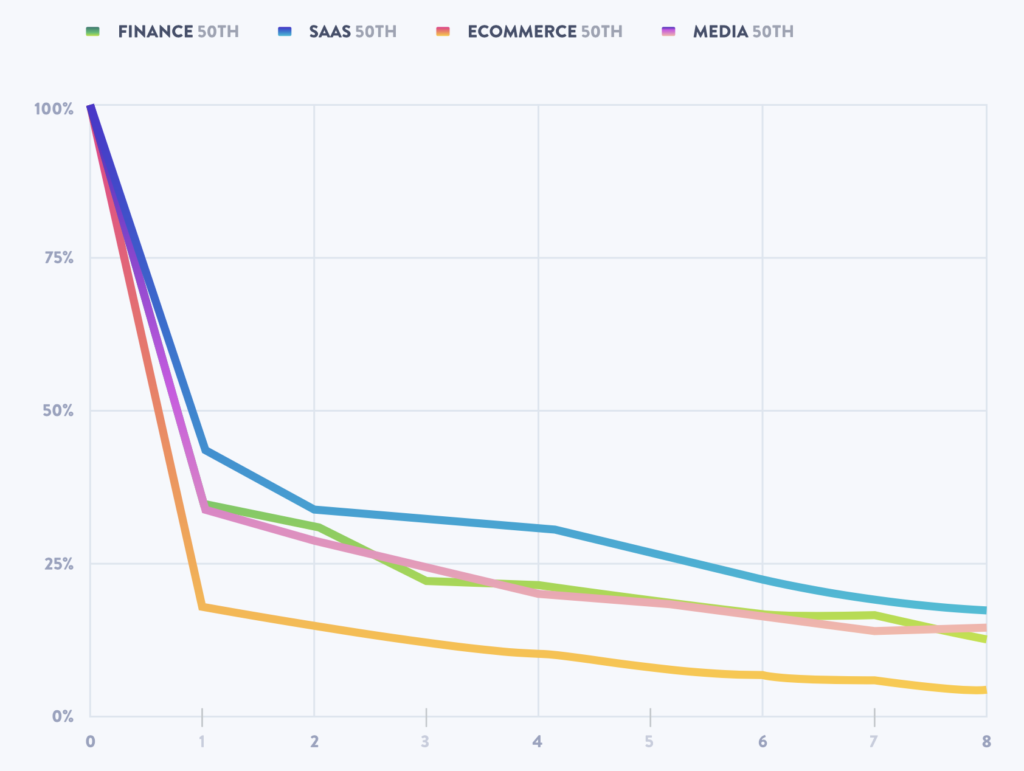
Customer retention data can be used in a number of ways. To understand your performance against competitors, compare your retention rates against those of your industry and apply context where possible (see image below). To understand your runway and inform your financial model and growth potential, look at retention rates together with your customer acquisition costs. For example, if only 20% of your activated users are still active after six months, and your business model requires thousands of users (because of low ARPU) to achieve profitability, that means you need to acquire 10x customers month-on-month to replace churned ones. This may or may not be sustainable in the long run. On the other hand, if you are experiencing high retention, and only need hundreds of users to reach profitability, you are likely on the right track. Run the numbers and identify where you need to focus your growth and retention strategy.
The most straightforward way to quantitatively measure retention is to observe the percentage of users that come back to your product days, weeks, or months after registration. However, it’s not enough to simply understand the numbers. You want to dig deeper to understand the reason behind strong retention or high churn. Sometimes, particularly in the very early stages, however, these numbers are less representative and more qualitative analyses are needed to understand retention or reasons for churn. Measuring NPS score, enforcing a strong customer feedback loop, gathering insights from customer support conversations and having 1:1 conversations with customers can go a long way toward providing valuable insights that can help you determine what steps you need to take to improve retention rates.
Here is a video from 500 Startups that can help you determine how best to begin evaluating retention rates for your business.
Creating dashboards and other visualizations will give you constant, actionable visibility into your retention metrics. At the beginning of your startup journey, you will likely see a dramatic drop off of customers. Once you see the curve flattening, you know that you are getting somewhere. For some, that flattening may come sooner, while others take longer to get there, and for some, the flattening may include a higher percentage of users while for others it may be lower. For example, we have seen a digital micro-savings product retain 20% of customers in LATAM, while similar offerings manage to retain 80% in Africa. We have seen micro-insurance products going down to almost 0% active users in just a few months but also seen others reach 75% active users after 6 months.
The important thing is to see that some people are continuously engaging with the product over time and that the curve eventually flattens. For some business models, a curve that flattens at 25% may be sustainable if customer acquisition costs are low and revenue per interaction is sufficiently high. However, if the financial model (e.g., high customer acquisition costs) requires higher retention rates for profitability, 25% may not be sufficient. In this case, keeping track of the data is the first step and then improving your value proposition and engagement would also be necessary.

“80% of new users stop using the average app just three days after downloading it”
source: Mixpanel
DOWNLOAD PDF
Collecting and analyzing frontend and backend data is relatively simple and inexpensive to do given that most tools are free (or close to free). In fact, once it is set up, ongoing costs are almost zero. However, it takes some effort to get dashboards and models set up since they will reflect your key business assumptions, objectives, and strategies. Clarifying this thinking and translating it into trackable metrics will require some effort and alignment among leadership. Such thought exercises are an absolute must for any startup serious about gaining traction.
Qualitative methods might cost a bit more in terms of man-hours and call center support, but the insights they provide are extremely valuable. Setting up a proper feedback loop with customers from the beginning will set you up early for success.
Keep in mind it would also typically cost more to re-engage a customer that has already tried your product and lost interest than it would to sign up a new customer, so tracking and focusing on retention from day 1 to keep customers engaged and loyal throughout can result in overall cost-savings for the business.
When it comes to collecting and analyzing data, no additional expertise is needed beyond that which is already on your team, assuming you have a tech team. If you don’t, at a minimum you should know how to manipulate Excel sheets. Take a look at the Catalyst Fund article that explains why upgrading your tech with AppSheets is simpler than you think. If you do have a tech team, your CTO, product person or anyone else on the team who has basic SQL skills can get cracking. If no one in your team can do this, there is likely an opportunity for someone to upskill.
Our resounding answer is that you should be tracking key metrics from the moment you get started, and that it should remain central to your decision-making process, every step of the way.
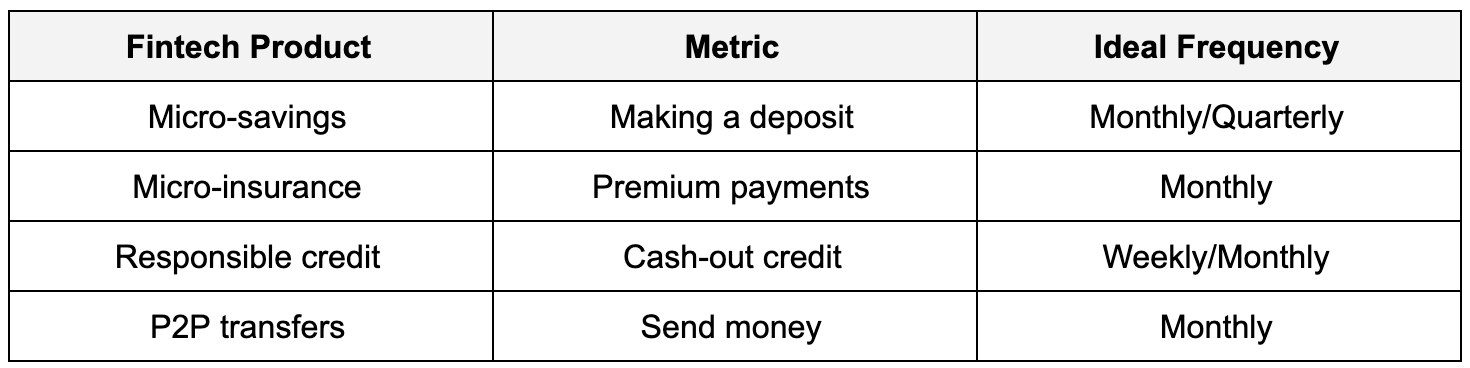
1. Identify the action that indicates whether or not a user is active, and attests to the value users get from your product. This metric could be an action that you want a user to perform, like making a purchase. This action should be traceable, which means a timestamped record is generated every time a user performs it.
The action has to be easy to measure, and sufficiently sensitive so as to give you new information every day. For example, a good action to choose might be: a user makes a transaction, such a deposit into an account, a loan withdrawal, or a payment to a merchant. Taking this action means the user is choosing your service over another. A poor choice might be: a user opens an app, a user checks her wallet balance, or a user requests some other type of information. These actions do not provide value to users and will not give you insight into whether or not they will stay.
2. Define the frequency at which a user would need to perform that chosen action to indicate value is still being delivered. Decide whether you are expecting your users to perform that action daily, weekly or monthly in order to obtain value, so that you are displaying data rationally.
For example, with a savings startup we considered that a user making a deposit into their account attests to the fact that they are getting value out of the service, and that we can expect different segments users to make multiple deposits on a monthly or quarterly basis. On the other hand, for a money transfer service, sending money is the key action, and we expect users to repeat that action on a monthly basis at least.
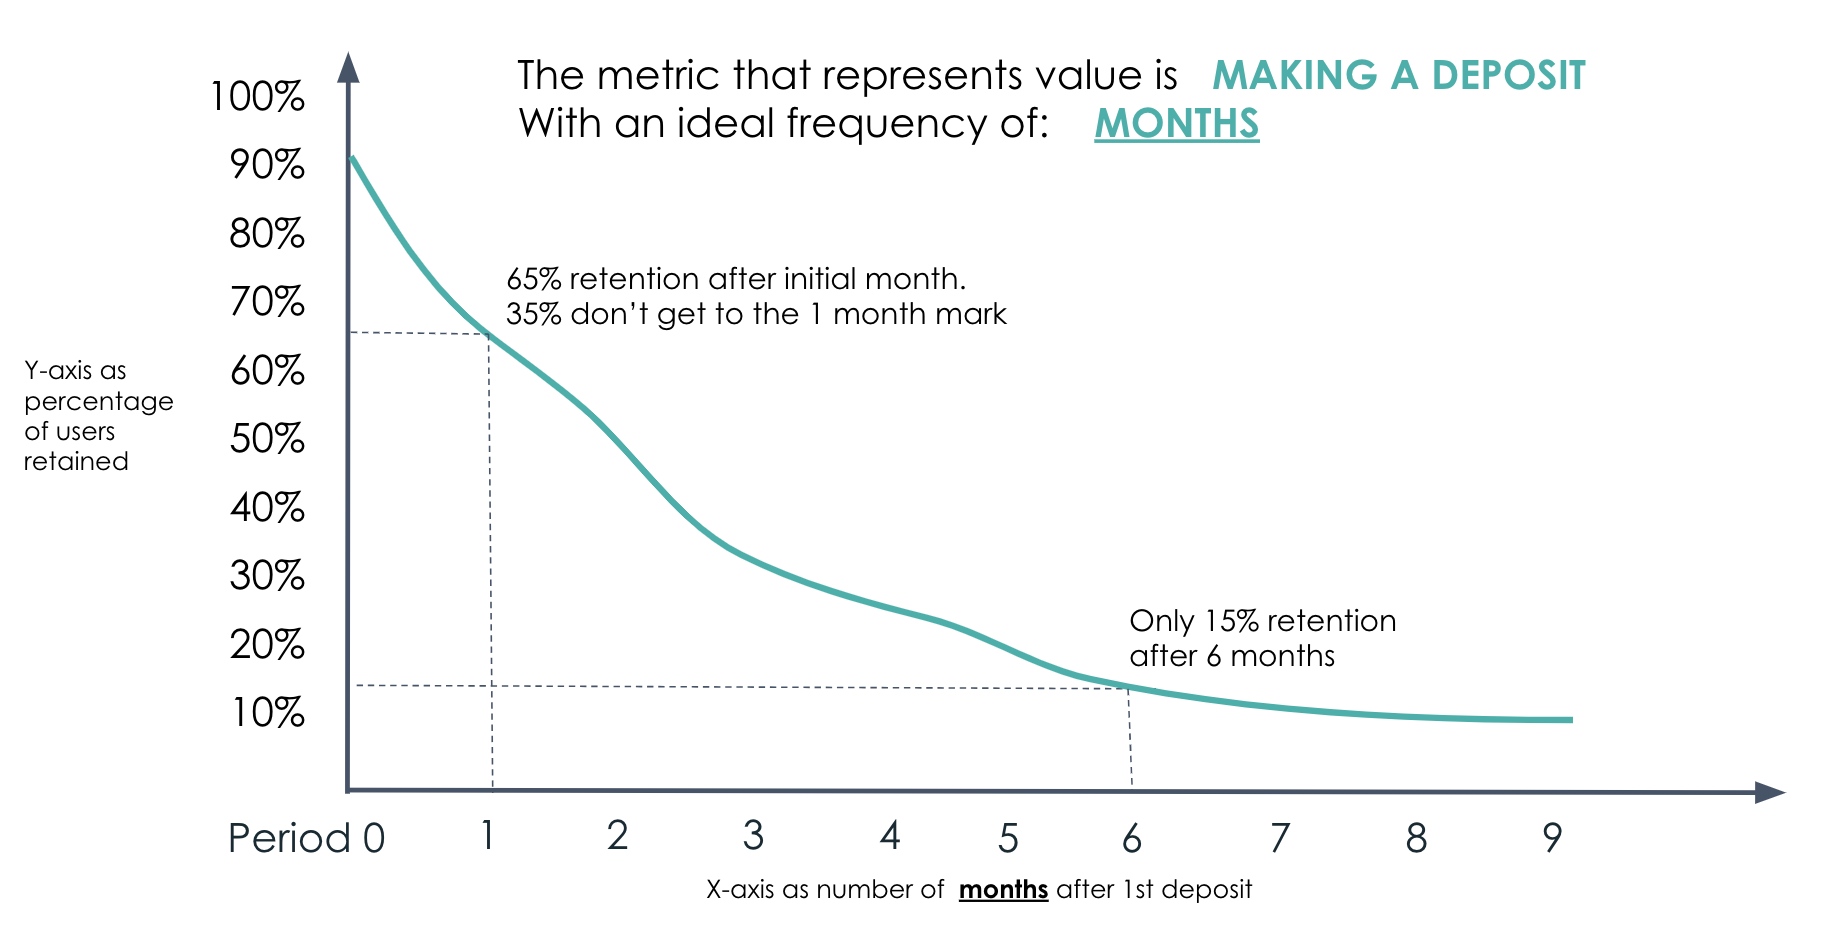
3. Measure the repeat usage of that metric. Set up a way to extract and visualize usage data so that you can see how that metric evolves on a daily basis.
Set up the right analytics tools: Tools for measuring usage will likely include Google Analytics or Amplitude, depending on the nature of your product. If your product runs on a smartphone app or web, there are now a variety of options to integrate these platforms within your app, and both of them offer retention analysis, among other things. In the case of Amplitude, the functionality is richer as it is designed specifically for retention analysis. See this Amplitude playbook for more on how to master retention.
Create a dashboard: Make sure your data is front and center, everyday! Whether it lives in Google Sheets, a SQL database like MySQL or SQL Server, or a noSQL database like Firebase or MongoDB; find a way to visualize it for daily use.
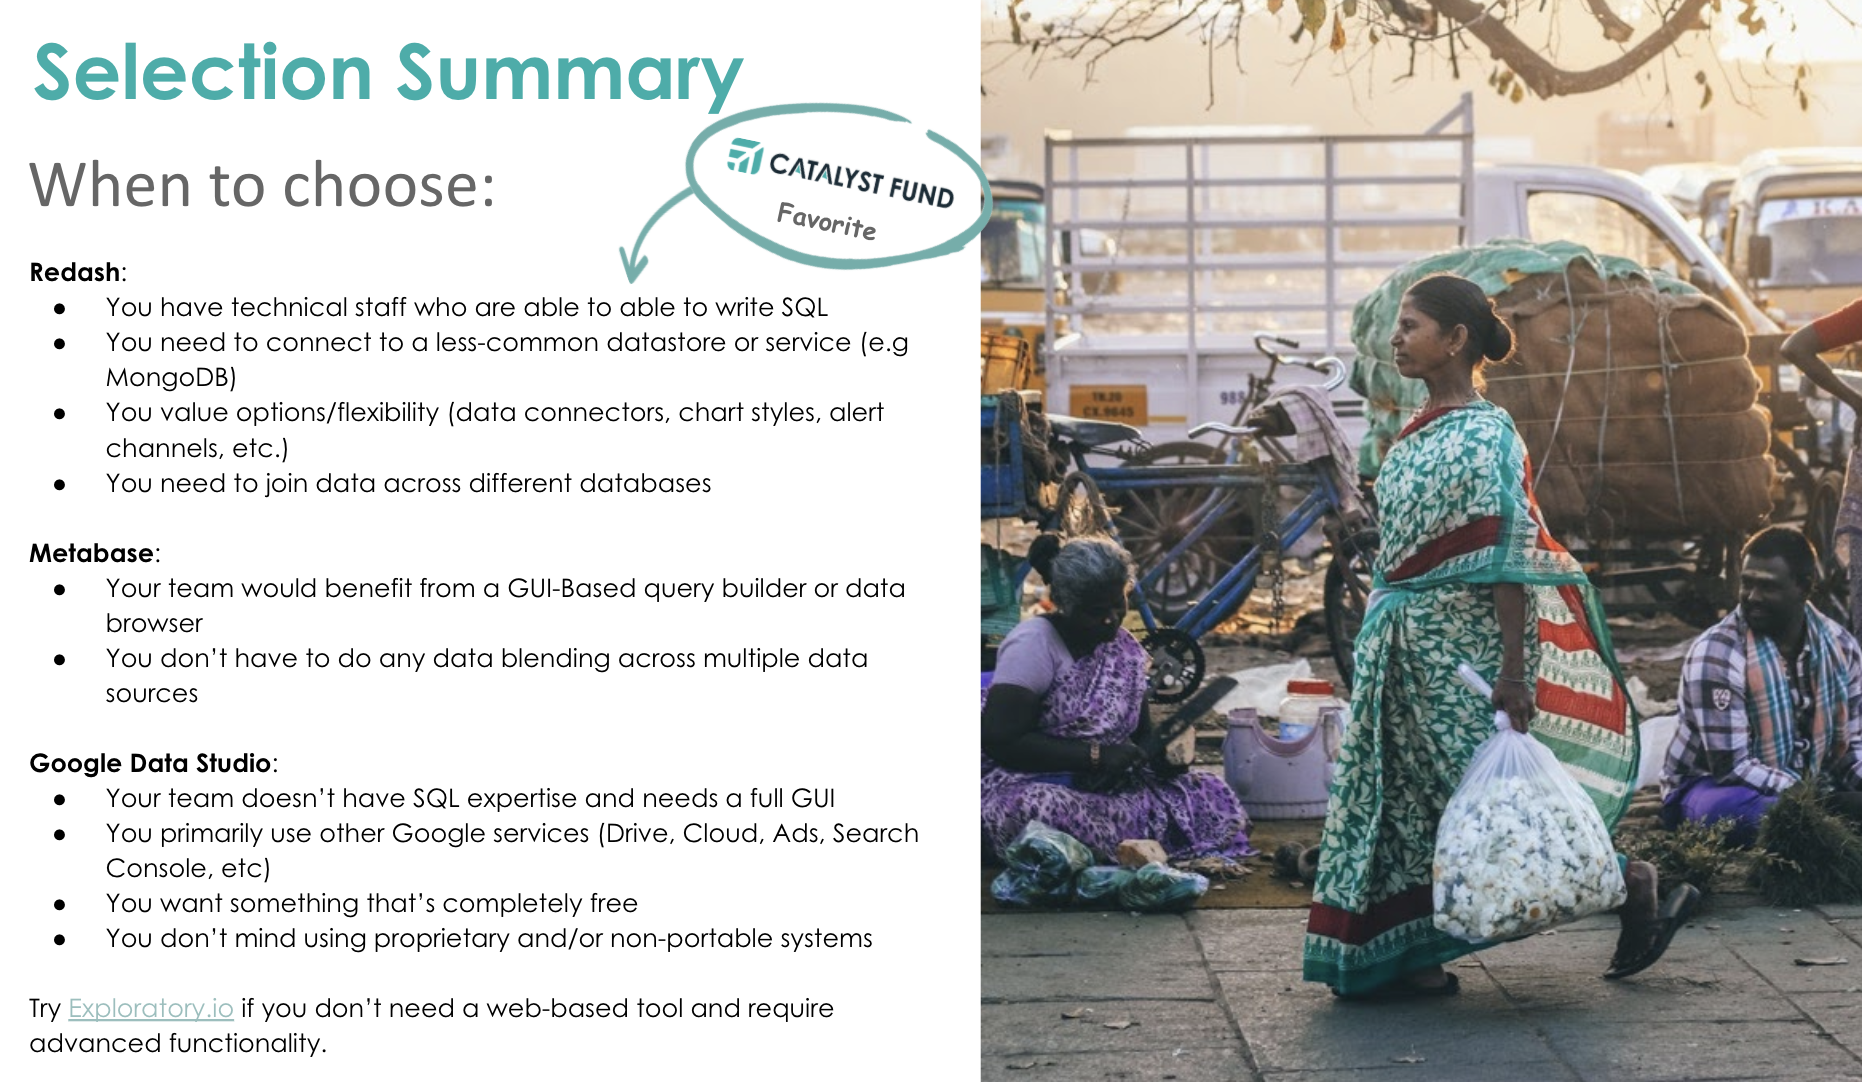
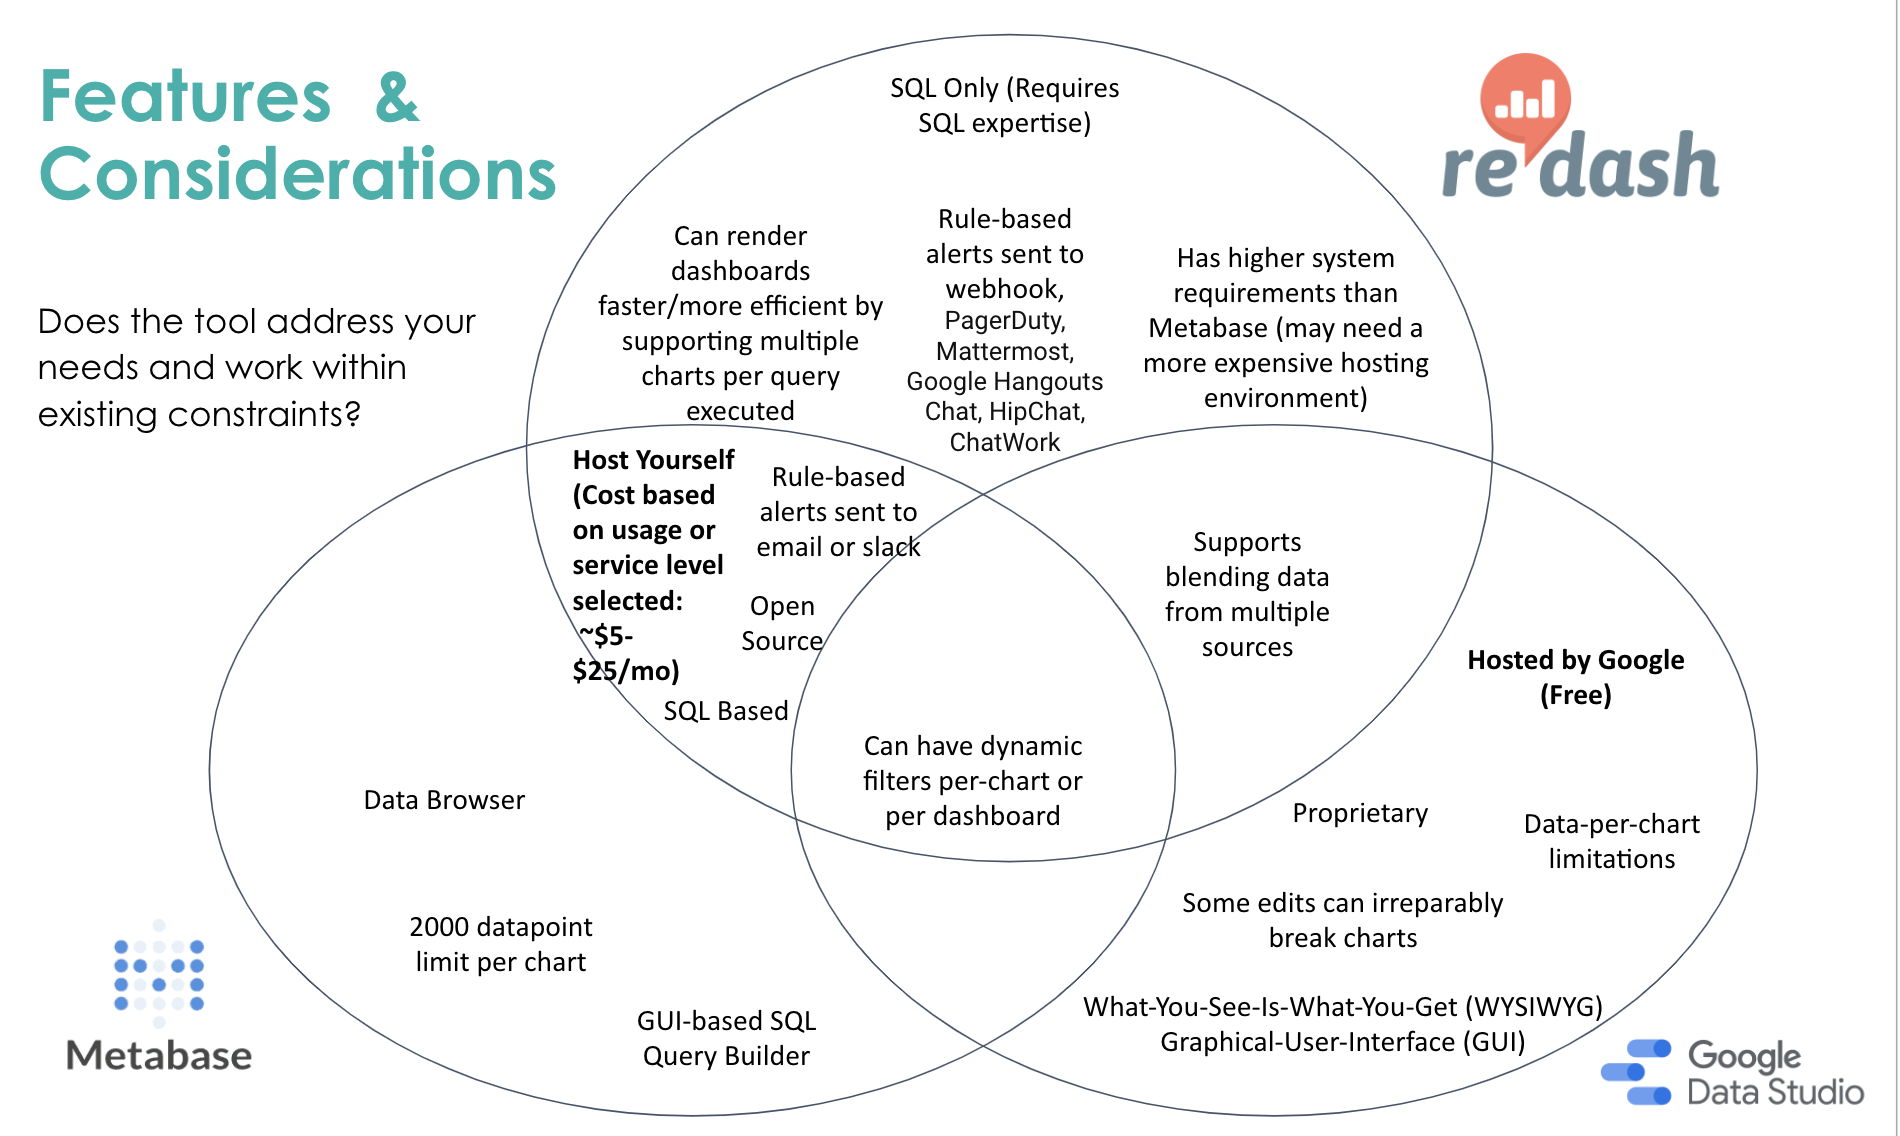
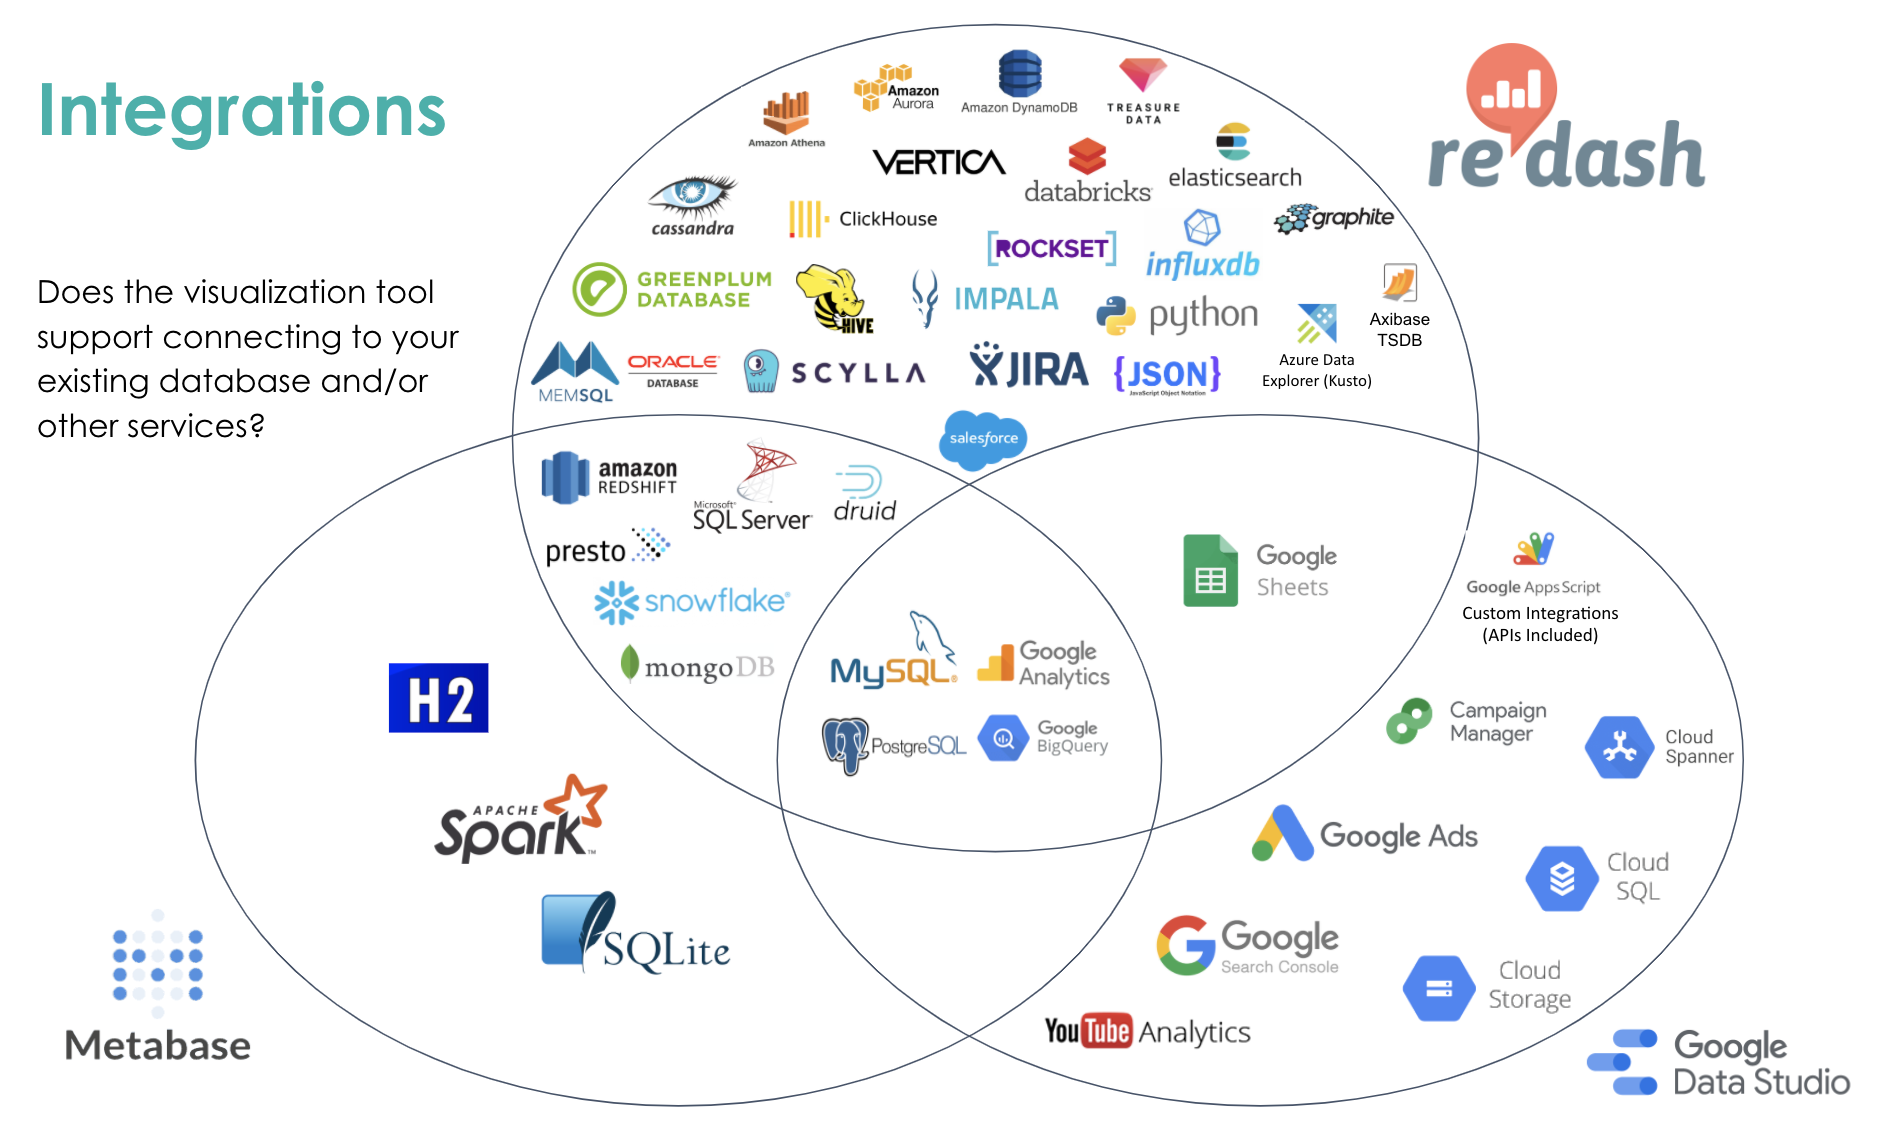
We recommend looking at these three dashboard tools: Redash, Metabase, or Google Data Studio. The one you choose will depend on your team’s skills, the type of database you have, as well as your willingness to use proprietary solutions. Check that your visualization tool can integrate with other services. See more on comparison of these tools below:
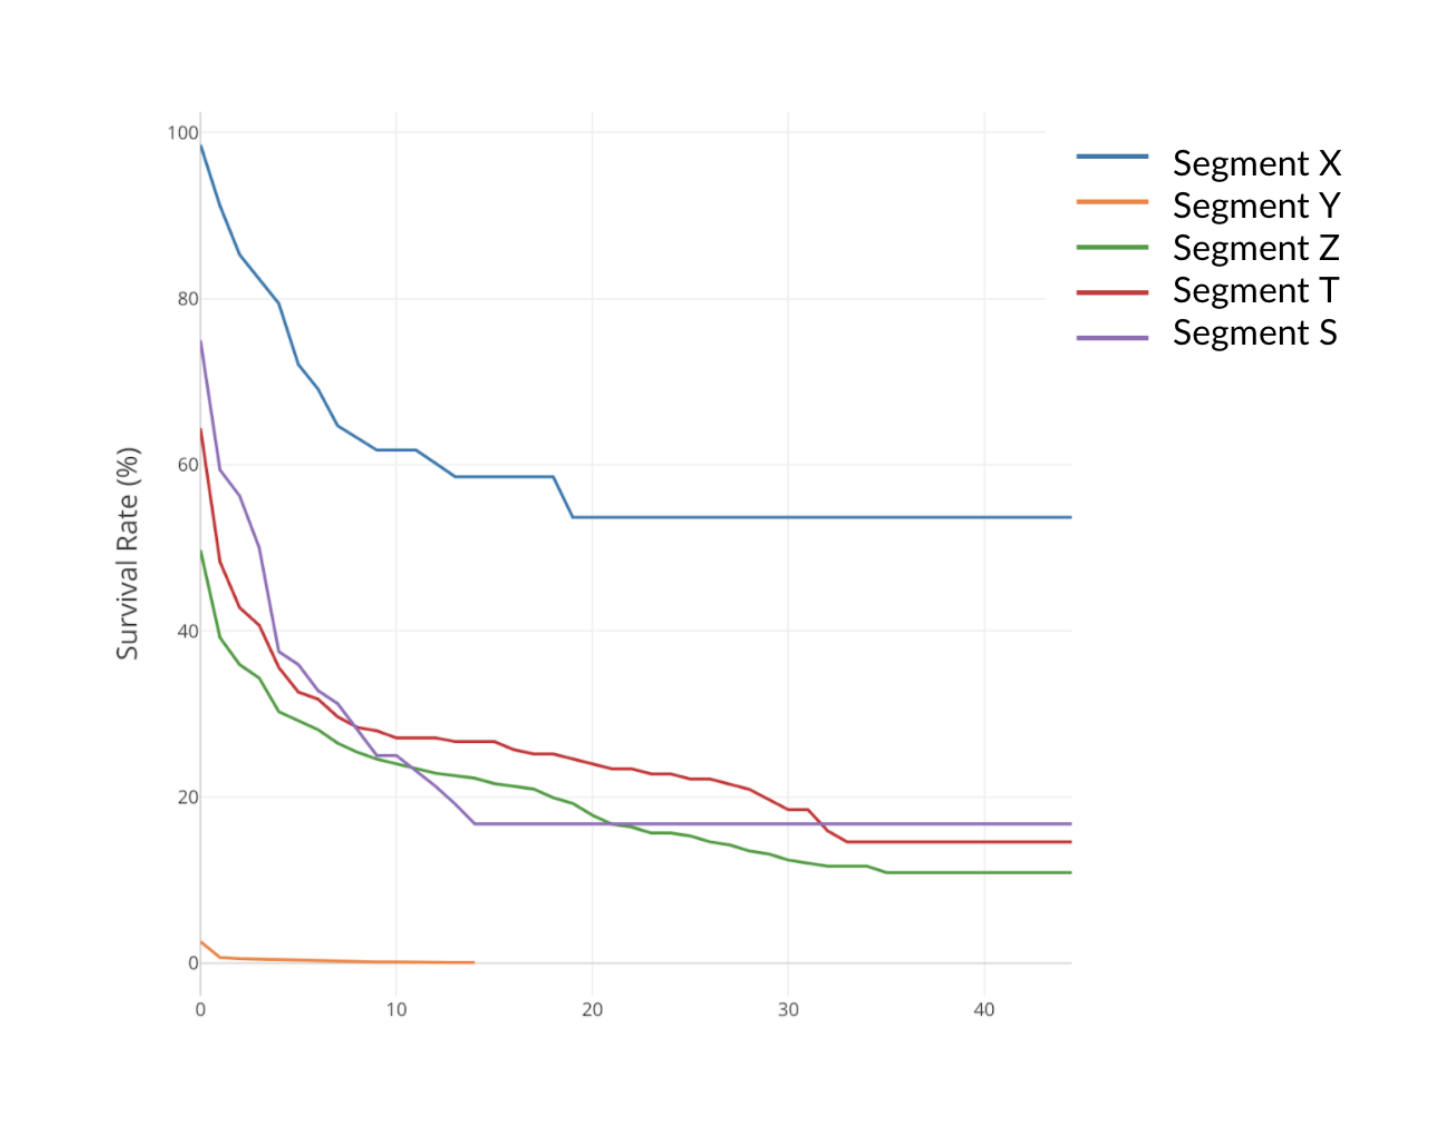
Visualizing retention by cohort will allow you to delve deeper when things may not be going well. You can, for example, see if there is a segment of users within your user base that has higher retention than the average. If so, this could mean that your product isn’t for everyone, as you first thought it would be, but that there are certain characteristics that define a subset of users who are finding more value in your product than others.
In the below example, segment X has considerably higher retention than the rest of the segments. Try to find out who they are, why they are using your product at such high rates, and how many of them are out there so that you can target them more reliably or adjust your product to appeal to more segments. Don’t forget to find ways of rewarding your early champion users so they remain loyal.
Read how FarMart was able to harness data to get true clarity into their business.
The ultimate startup dashboard: 7 charts and startup metrics for founders to live by
Getting your dashboard right will likely be a turning point for your business, your leadership, and even your bedtime routine, since you are likely to check these first thing in the morning and last thing before you go to sleep!
Retention is the metric when it comes to measuring PMF. When you have high retention, it tells you that you have built something that people want, are getting value from your product and coming back. If it is low, then don’t turn on the acquisition taps yet. Fix it first.
Dashboard tool selection summary, a valuable comparison of Redash, Metabase and Google Data Studio. In addition this dashboard cheat sheet is a primer for creating a dashboard using readily-available, low-cost (or free) tools according to best practices with pro tips. It specifically helps you (1) Define the main metrics for your business, (2) Create the dashboard and (3) Socialize with your team.
Mastering Retention by Amplitude
Retention is critical for every product, whether you’re at a Fortune 500 company or a 5-person startup. Learn proven methods for building a data-informed retention strategy.