What makes customers choose one transaction product over another?

This is the second case study in our report, ‘Inclusion and Your Bottom Line’, which outlines a new mixed-method approach to characterizing and measuring inclusiveness for financial products and services.
Undoubtedly, there has been tremendous progress when it comes to improving access to financial services, with 515 million more adults globally reporting account ownership at a financial institution or a mobile money provider in 2017 than in 2014, for a total of 69% of the world population. However, to improve the overall financial well-being of customers, appropriate and consistent usage of financial accounts is a prerequisite. To date, not all people with an account actively use it. In fact, one fifth of those with an account at a financial institution in lower income and lower-middle income countries reported not having deposited or withdrawn in the past 12 months. In order to spur commercially viable financial inclusion by achieving increased and sustained account usage, the design and delivery of financial services must be optimized to meet the needs of consumers.
Using quantitative and qualitative surveys and choice modeling, we evaluated from the perspective of the customer what currently contributes to low account activity in emerging markets, what can drive adoption of new transaction products, and what can contribute to increased and sustained account usage.
We have identified certain high-level factors/ features that customers commonly demand of their transaction products. These product-specific factors – identified as reliability, value, accessibility and affordability – often make up the ingredients for an inclusive product from the customer’s perspective. Within these factors are a wider pool of sub-factors such as user-friendliness, security, convenience, wide acceptance and availability etc, which are often defined in financial inclusion literature as being integral to the inclusiveness of financial products, particularly payment products. How, then, can these traits be measured to assess the degree to which a product is considered inclusive?
To answer this question, the BFA team piloted a customer research exercise designed to: (i) methodically measure these factors/ (also referred to as attributes or traits), (ii) determine how they rank against each other in the mind of a customer when they are selecting one transaction product over over another at the onset or for sustained usage, and (iii) validate the high-level factor sub-components across different markets. The approach and outcomes from objectives (i) and (ii) are addressed in this case study, while those related to the later objective are addressed here.
Methodology
The customer research exercise combined both quantitative and qualitative research methods as described here. In particular, the quantitative portion was made up of two complementary exercises: choice experiment and likert scale measures.
The first exercise was a choice experiment (choice modeling, thereafter), designed to (1) estimate the marginal effect of each attribute on a respondent’s likelihood of switching to a new account, (2) estimate the value of each attribute to respondents (willingness to pay), (3) estimate market share for the new account under different specifications of attributes, (4) and identify groups that are amenable to the new accounts (market segmentation).
In the choice modeling exercise, respondents were asked to choose from three accounts: the respondent’s most frequently used account (“existing account,” hereafter) and two hypothetical new accounts with differing permutations of desirable features. The exercise created different scenarios where various attributes that we aimed to measure changed across products two and three, which were essentially being compared to the existing account. We used multinomial logistic regression to model the respondents’ choices and identify drivers of their choices.
The second exercise was a likert scale exercise that measured negative or positive responses to statements describing the mentioned high-level attributes as they pertained to respondents’ experiences with different transaction products. In this exercise, we assumed that transaction products considered to be more inclusive (i.e. those exhibiting the factors noted above) would be reported as the most-used accounts; hence they would score more strongly according to the most important attributes demanded by customers, compared to the alternative transaction products respondents had but did not use as much.
We deployed the two measurement exercises with a hypothesis that they would generate similar results (i.e they would confirm that the same or similar attributes rank in the same order when customers are selecting a transaction product). However, we found that choices made along the customer journey in fact hinge on different attributes. In other words, customers consider different attributes to be most important during acquisition and usage/retention phases.
What makes customers choose one transaction product over another?
In the hypothetical market scenario (choice modeling) involving just over 1,000 active digital transactors in Kenya and South Africa, we found that transaction product customers indeed favor some product attributes over others, but their choices are also influenced by demographic factors, financial histories and market contexts.
In both markets, we compared the impact of the following attributes on a customer’s decision to choose a particular account:
- Availability of a broad range of services, in addition to sending and receiving money (e.g. sending money only versus adding on bill payment, financial planning, savings, and credit capabilities)
- Quality of customer service
- Speed of resolving complaints
- Time to account physical access points (e.g. ATMs, branches, agent, retailer)
- Ability to make transfers across different providers at various levels of cost (notwithstanding other frictions)
- The affordability of deposits and withdrawals
- Cost of running the account
Of all the attributes incorporated in the scenario design, the promise of free transactions (which implies increased affordability) and fast recourse (i.e. when problems are resolved quickly) had the highest impact in swaying customers to choose an alternative account in both countries. The swing effect was even stronger in Kenya for all three attributes, implying that the Kenyan market was in need of these attributes more than South Africa.
Factors such as a reduction in the time it takes to get to physical access points, improvements in quality of customer service, the ability to avail transfers across different providers at a cost, and additional services for the transaction product beyond just sending and receiving funds did not have a significant impact in swaying respondents’ decisions. This is one of the reasons it is important to consider the context when evaluating the results. Both Kenya and South Africa offer considerably progressive financial services which already address the latter attributes. For instance, according to FinAccess data (2019) formal financial financial access points in Kenya are within a 30-minute walk for about 85% of the population. Consequently, only disruptive improvements in the said attributes would result in a significant shift.
The impact of demographic and historical attributes on a customer’s likelihood to switch accounts
Additionally, it was evident that certain segments of the population are more likely than others to jump ship when presented with what they consider to be a better proposition than their existing transaction product, as shown in the diagram below. For instance, in Kenya males and younger transactors (< 30) were more likely to be swayed whereas in South Africa it was both genders, aged 30-50.

Based on the above, assuming that Thabo – a South African aged 35 – had a bad experience with the account he most frequently uses, he is likely to be persuaded to switch to a new account that promises to be more affordable and solve any complaints within 24 hours.
However, opening an account is just the first step. We also set out to determine whether customers like Thabo will sustain active usage on his new transaction product moving forward, if he does indeed make that switch.
What makes customers more actively use one transaction product over another?
In both Kenya and South Africa, whereas elimination of fees and faster resolution of complaints majorly influence a customer’s choice in taking up one product over another, the analysis yielded different results when it comes to sustained usage.
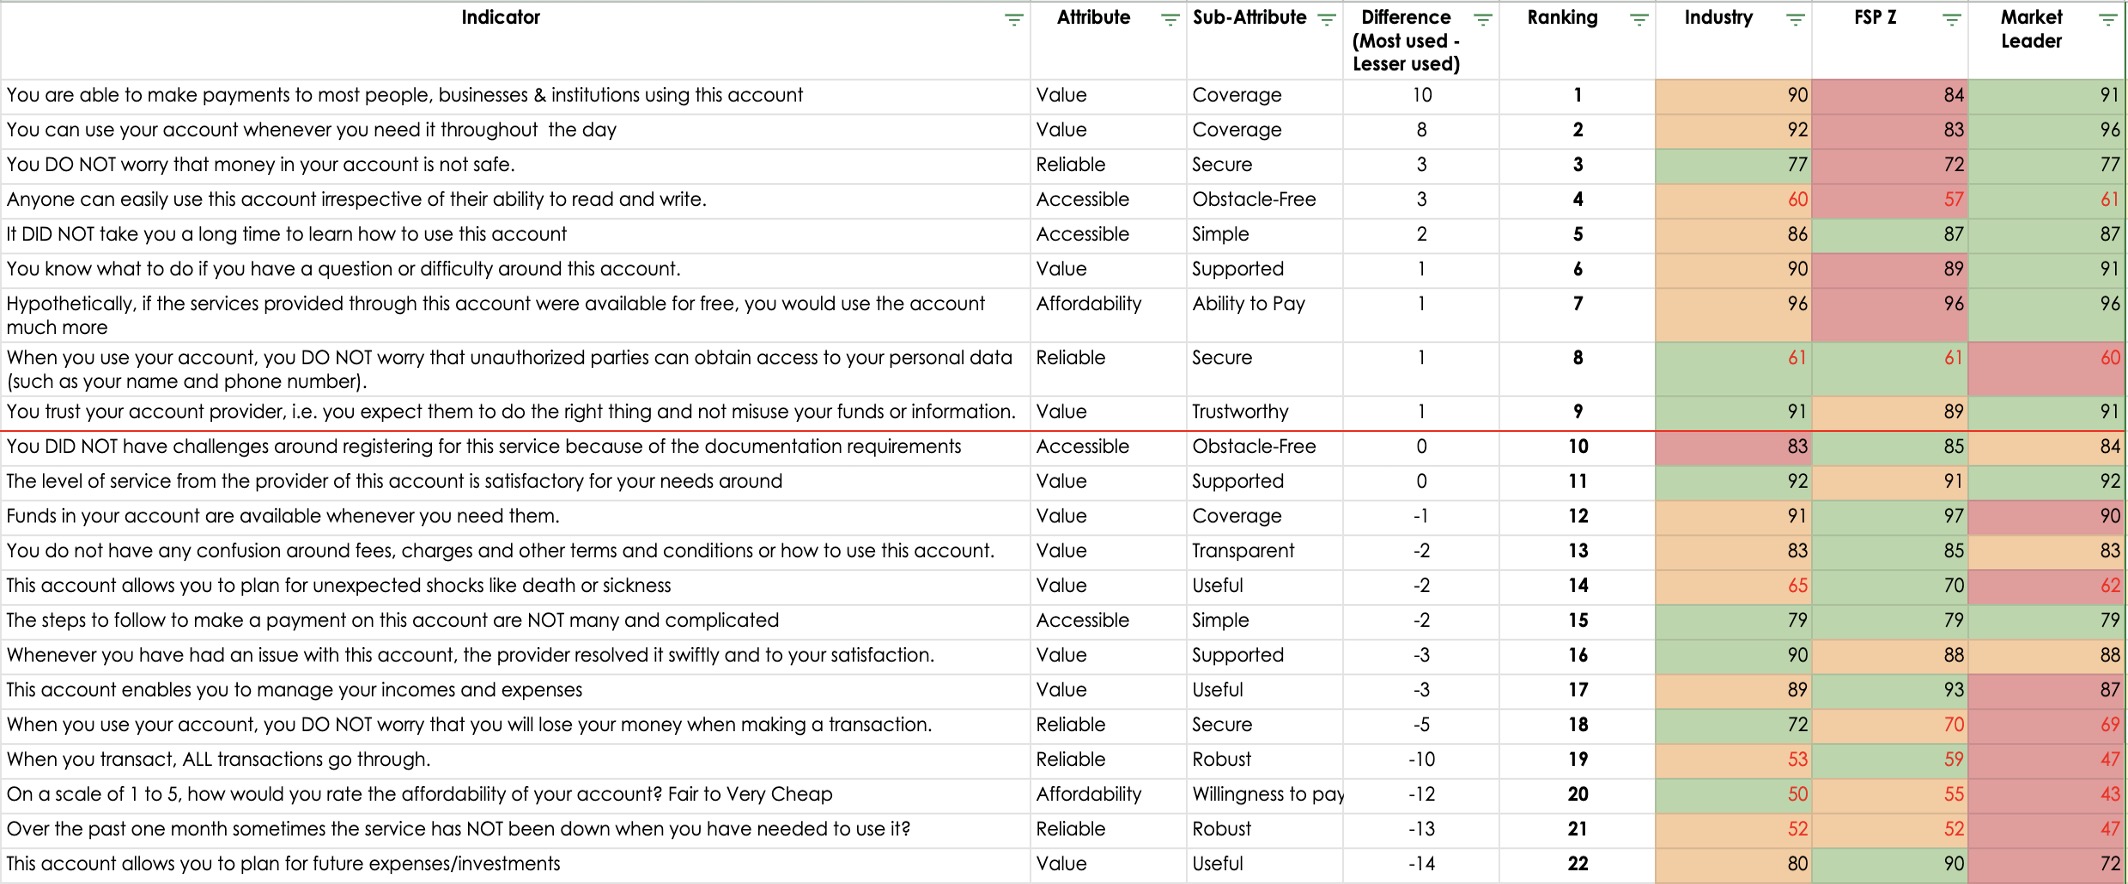
In Kenya, coverage (i.e. wide acceptance and convenient access, meaning that an account can be used anywhere, anytime, and crucially, is accepted by most counterparties) is the biggest determining factor of which account Kenyans use the most to transact when comparing between alternatives. Accounts with a higher coverage score trump any alternative option that is: significantly more reliable in terms of the system uptime and rate of successful transactions, more affordable, and offers the ability to plan for future expenses and investments. However, most of these latter factors are generally poorly provided by the entire industry, as shown in Figure 2 below. We determined that a score of less than 70% signaled poor provision.
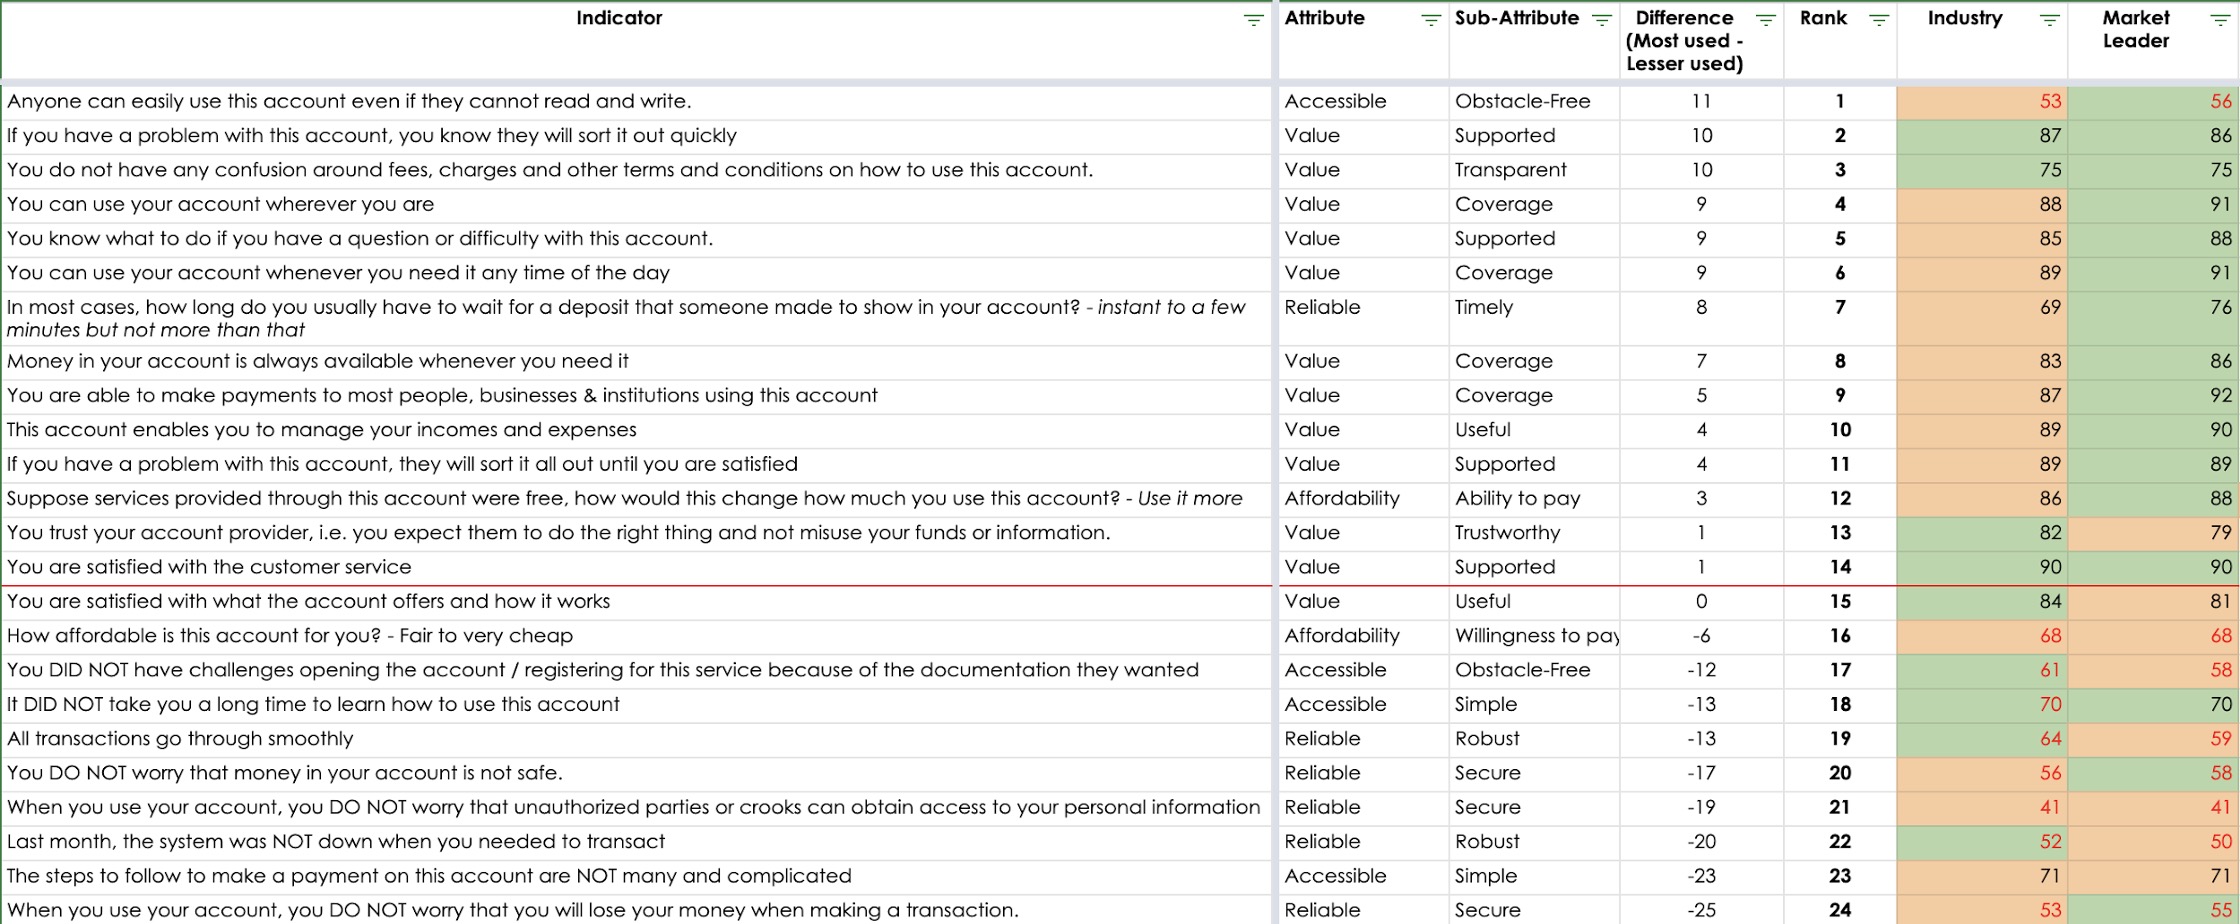
In South Africa, fast recourse is the attribute that still holds most water when customers select which transaction product to use more. In fact, factors pertaining to strong customer support and accessibility – including ease of use and coverage (just like in Kenya) – emerged as the strongest factors that drive sustained usage. Once again, although the alternative account options might be more affordable, easier to register, easier to learn to use, less susceptible to downtimes/ failed transactions, and considered more secure; these attributes did not emerge as strong drivers of usage despite how pivotal they are for a sound and accessible payment system. They were also poorly provided for by the entire industry.

It was also possible to assess how different institutions scored against each other and the industry, for those institutions that had sufficient customers represented in our sample. What was interesting to note is that the transaction product market leader in both markets scored above the industry average in almost all the same attributes that emerged as strong drivers of sustainable usage, which further validated the approach. See Figure 2 and Figure 3 which compare market leaders in Kenya and South Africa respectively. The leading scores are highlighted in green, the second position is highlighted in yellow while the third/ trailing scores are highlighted in red.
Moreover, industry concerns/ market failures also became evident. As previously mentioned, these failures are signaled by scores of less than 70% and are indicated in red text in Figure 2 below.
Conclusion
There are certain factors/ attributes related to a product’s inclusiveness from a customer perspective that drive uptake of transaction products but do not necessarily drive sustained usage. Factors related to affordability and the promise of faster recourse are likely to convince customers to switch products or open a new account, but this may not translate to consistent usage of that account in the long run, once customers realise that, for instance, the account cannot be used anywhere, anytime and to pay most counterparts; and the support is poor. Customers will go dormant and then drop off, impacting the bottom line.
The approach we developed to measure inclusiveness is complementary to past work that aims to identify and begin to measure drivers of uptake and usage in transaction products, such as Report on Payment Aspects of Financial Inclusion, The access frontier as an approach and tool in making markets work for the poor), and Making good use: A measurement framework for financial service usage. However our framework goes beyond these studies to provide a practical approach to measuring specific factors from a customer’s perspective.
Our approach is also valuable for providers, as it offers them the ability to assess their scores according to the different attributes and benchmark against their peers and the industry as a whole, highlighting which factors they need to bolster to increase usage of their products, thus making them more viable and competitive.
Payment regulators could utilize the proposed approach to measure progress towards the targets set out in the national payment strategies, which often align with the product-specific factors described at high-level or granularly. Moreover, the lower industry-wide scores signal to policy makers where interventions might be required and how interventions could be more targeted by identifying the institutions that score below their peers and the industry average.
Although there may be room to calibrate the tools and methodology applied, the results generated validate the defined approach as being effective for undertaking practical measurement of transaction product attributes across various markets. The approach could be applied more widely as a standalone survey or adopted as a module in global or national financial inclusion surveys.
Methodology of data collection for the demand side
We applied various research methodologies, as described below:
Quantitative research
We undertook survey research, where we used a three-part structured questionnaire. The first part of the questionnaire collected demographic and transaction product usage details through multiple-choice questions; the second part compared the attributes of the transaction products used by respondents, as reported in part one, through likert scales; while the third part of the questionnaire incorporated choice experiment design – a well-established marketing and policy evaluation tool – to develop a hypothetical transaction product scenario.
We deployed the survey through face-to-face interviews in Kenya and South Africa, while in Nigeria, we had to rely on phone interviews due to COVID-19 restrictions.
Some of the advantages of using this research method were:
- More structure: We had designed the questionnaires to collect numerical data.
- Larger sample sizes: We used a large sample size representing the population to ensure statistically significant results.
- Replicable: The same study was replicated across three markets.
- Useful for decision-making: Data from quantitative research—such as market size, demographics, and user preferences—provides essential information for the financial services provider partners that we worked with.
- Arranged in simple analytical methods: Data was received in the form of numbers and statistics, often arranged in tables, charts, figures, or other non-textual forms.
- Relatable: the research aimed to make predictions, establish facts, and test hypotheses
- Consistent: The data we collected was precise, reliable and consistent
- Fast: Data collection was relatively quickly (e.g., telephone interviews)
Qualitative research
We also undertook qualitative research after we had deployed the quantitative survey research. It offered an opportunity to delve deeper into issues of interest that we already established and add a human voice to some of the results that we had started seeing from the quantitative analysis.
We conducted in-depth telephonic interviews in Kenya and conducted focus group discussions in South Africa. We did not deploy qualitative research in Nigeria due to logistical complications brought about by COVID-19.
Some of the advantages for using this research method were:
- Quotes from open-ended questions in qualitative research put a human voice to the numbers and trends we saw via the quantitative surveys.
- Enabling customers to describe their experience when using bank products honestly and in their own words, helps point out blind spots.
- It provided a better understanding of why an attribute may shift customers’ behavior, offering a definitive explanation, which would allow providers to adapt to the perspective shift.
- The methodology allowed for relationship-building which is important for customer retention. Customers that we spoke to expressed that the engagement left them feeling valued by the FSPs we presented.
- This methodology also eliminated bias inherent in data, as respondents attempt to answer questions in a way that pleases the researcher. During qualitative interviews we used various techniques to encourage the respondents to be themselves, which produces more honest insights.
- Qualitative interviews allowed for flexibility, and unlike in the quantitative method, focuses on data subtlety. We obtained as many details as possible, whether those details fit into a specific framework or not. It is within those details that we discovered surprising insights that we had not planned to uncover.
Both qualitative and quantitative research methods have their flaws, but when used in combination, the desired end result can be extremely powerful.
READ MORE
Inclusion and your bottom line
A new mixed-method approach to characterizing and measuring inclusiveness for financial products and services, as carried out in Kenya, South Africa and Nigeria.