Designing for Data: Creating a User-Friendly Dashboard to Analyze Product Profitability
Most financial institutions recognize that data should lie at the heart of strategic decision-making. With technology playing an increasingly central role in every aspect of business operations, data can make a business more agile, more client-centric, and ultimately, more profitable.
However, the use of advanced data analysis tools is still relatively new and many institutions are finding their way. This prevents them from making well-informed, strategic decisions, often at a high cost to themselves and their clients. But how can an institution create an environment in which data-driven decision-making becomes the norm rather than the exception? To start with, institutions must craft data analysis tools that meet the needs and preferences of the users within the business to ensure that they are relevant and actually utilized.
Acreimex — the Mexican savings and credit cooperative which has participated in the OPTIX project since 2016 — began using an Excel-based business case model designed by the OPTIX team to analyze product profitability. However, the team soon discovered that just providing an analytical tool to managers was not enough; they needed to refine and customize the design of the tool with a user-centric focus to ensure its usability and utility in the long run.
Product Profitability Analysis Triggers Interest in Data-Driven Decision-Making
As a first step to implementing data-driven decision-making within Acreimex, the OPTIX team used an Excel-based tool to analyze the profitability of Acreimex’s savings and credit products. The exercise revealed the financial performance of each product. It also enabled the team to zero in on the impact of operational variables on the overall cost and expense structure of their portfolio, and to combine value ranges for income-generating variables.
This analysis resulted in innovative and proactive decisions for managing the product portfolio, which increased product profitability. For instance, the Acreimex team modified key features — including interest rates and credit origination costs — of the flagship group credit product, which made the loan profitable on the first loan cycle, rather than the eighth. Such a direct impact on the bottom line generated considerable interest in the potential of this kind of analysis among the first users of the model — the product managers of critical product lines.
Identifying User Needs: A Foundational Pillar for Designing Powerful Analysis Tools
The initial interest in the tool and the analysis it enabled included many “aha moments,” and raised hopes that the Excel-based tool would be used independently by product managers. Contrary to expectations, however, usage of the tool remained very low in the months following the exercise.
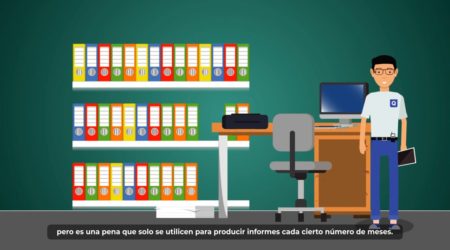
Conversations with users revealed that they had reservations about using an Excel file with innumerable spreadsheets containing advanced formulas. They feared they would ruin the file by inserting data into the wrong cell.
It became apparent that, to ensure the relevance of the tool to the decision-making process of the business, the design of the tool itself had to take the needs and preferences of the end user into account. This meant understanding the relationship between the user and the business, and developing a user-friendly tool to drive usage. The challenge was to combine robustness with user-friendliness to create a tool that would be relevant in the long run.
Balancing Robustness and Simplicity
After some deliberation the OPTIX team decided that an online dashboard would achieve the right balance between robustness and simplicity. The dashboard they developed consists of a master file containing the calculations, formulas and advanced code interactions, which is paired with a mirror file that holds personalized views with only the information relevant to each user. An appointed “chief model manager” within Acreimex has unrestricted access to the model, while other users can only input information or access exit reports depending on their role in the institution (such as savings coordinator, human resources manager, etc.).
By allowing differentiated access for users with customized views according to their needs, the dashboard enables users to interact with the tool easily, obtaining results on their products’ profitability and determining the impact of changes to different cost and revenue variables, without becoming overburdened by functionalities not relevant to their role. These interactions are completely independent of the master file and do not impact other users.
For example, group loan analysts can access the module focused exclusively on products that are of interest to them, while the credit portfolio coordinator can see full overviews of the profit-generating variables for each individual loan product and for the portfolio as a whole. Similarly, savings and credit product coordinators can test and visualize the results of changes to interest rates, loan amounts or savings balances, while the CEO, in turn, can see up-to-date analysis of the performance of all financial products, individually or collectively.
The dashboard is also a collaborative tool for data entry that allows each business area to provide information for the financial model separately. The selective access the dashboard provides to each user is especially important in this regard because there are users who manage sensitive or confidential information, such as salary costs and sources of funding.
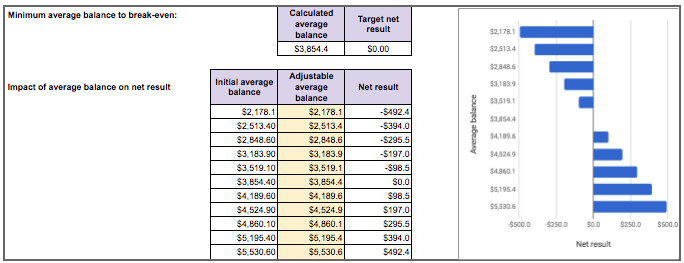
The dashboard has additional analytical power, allowing Acreimex staff to conduct product profitability analysis of each user’s portfolio according to financial and operational information that is easily and safely updated on a monthly basis. They can also use the dashboard to build business cases by combining different variables and perform sensitivity analysis for decision-making.
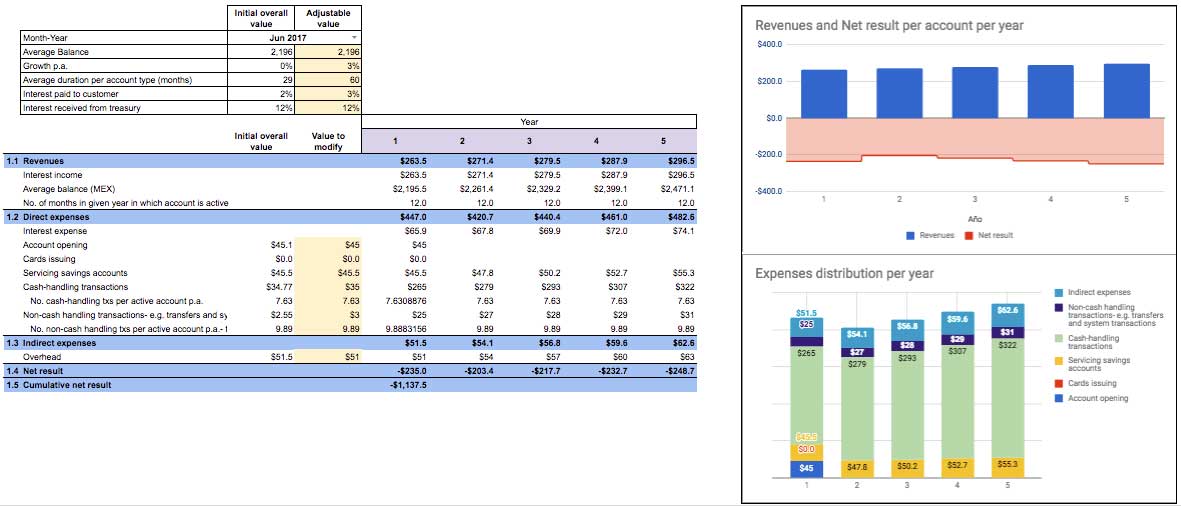
A total of 7 personalized “dashboard views” were created for “input users” (managers and leaderships who have permission to change inputs) and 41 for “consultation users” (officers and analyst who want to analyze data). Each file has unique access privileges depending on the user type. Personalized dashboard views ensure that each individual has a clean and simple interaction with the tool without sacrificing its overall robustness.
Process Design to Achieve Usage Over Time
To drive dashboard usage now and in the future, the tool needed to fit into Acreimex’s processes without disrupting users’ daily schedules. The OPTIX team created a comprehensive, straightforward manual to support onboarding and use. It details each activity, defines user roles, and establishes when each activity should be performed. There are online summaries of the manual that are tailored to each user, as well as interactive explanatory videos that make it easier for users to operate the dashboard as part of their normal routines.
To give the chief model manager confidence in the tool, he/she retains control over everything happening inside the model at all times. The process for making changes has inbuilt points of control as well as interactive authorization flows, which automatically generate emails and approvals at the touch of a button. These processes ensure that users have confidence in operating the tool.
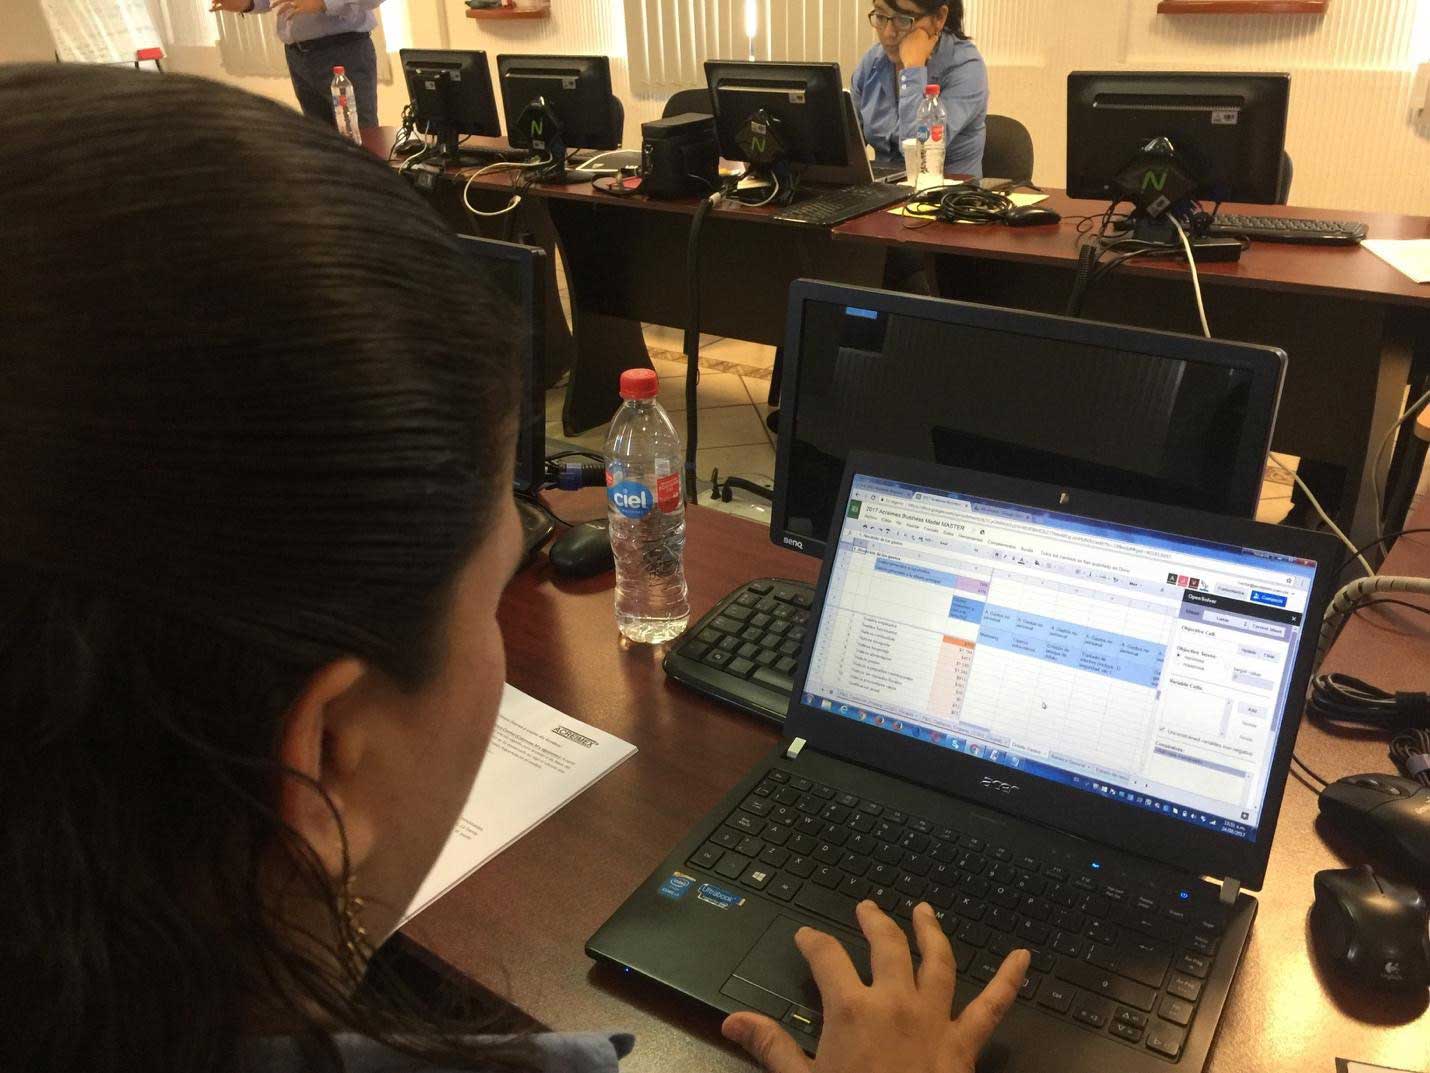
All of the features were tested with the relevant users during several training sessions. These sessions were excellent opportunities to collect valuable feedback to perfect the dashboard and ensure its successful and seamless usage.
Takeaway: User-Friendly Tools Can Enable Data-Driven Decision-Making
Ultimately, Acreimex’s dashboard users found that the tool helped them to identify and control the operational variables that impact the profitability of each product; link strategic and financial planning to profit expectations per product; and ensure the profitability of newly designed products.
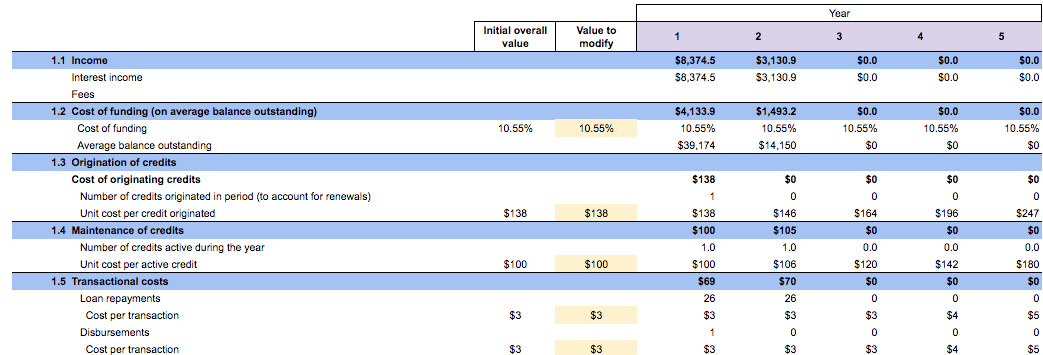
Both direct dashboard users and Acreimex’s executive board members have noted the dashboard’s usefulness, pointing out that it simplifies product profitability analysis to a degree they had not experienced before. The results have supported strategic management decisions, the value of which should not be overlooked by institutions similar to Acreimex. Such analysis will be even more relevant in an increasingly competitive and technology-driven environment, where well-informed and expeditious decision-making will be key to guaranteeing institutional viability.
Stay tuned for a forthcoming toolkit that OPTIX is developing to enable other institutions to benefit from this dashboard.

