Gallup Survey Shows Financial Security and Control Rises with Financial Inclusion, But Not Equally or for All
[This post has been updated with a postscript on July 27, 2018.]
In the pursuit of solutions to persistent poverty and inequality in our world, we often charge ahead with well-meaning programs without ever stopping to step back, see if the problem has changed in nature, or whether our actions still represent the best solutions. For example, “everyone” knows that handing out bank accounts should improve financial well-being, right? But does it, given that a vast majority of accounts opened are either inactive or have very low balances, or both?
Well, we can now actually start to reality-check some of those assumptions. Gallup’s new Global Financial Health Study of 15,000 individuals worldwide tells us that:
- Those who use formal financial services are much more likely to report greater levels of financial security and control.
- Some demographic characteristics, particularly employment, are strongly correlated with financial security and control, but gender, not so much.
- Employment and youth showed interaction effects while gender and marital status do not, meaning that there are more-than-additive effects when the employed and youth use formal financial instruments.
- There are strong country effects, encouraging us to continue to get to know low-income customers — whether we visit by matatus, tuk tuks or rickshaws — and learn more about their financial lives.
The MetLife Foundation-backed initiative set out to understand worldwide perceptions of financial control and security, which in turn are key components of financial health. Between January and March this year, Gallup conducted its survey across 10 countries — Bangladesh, Chile, Colombia, Greece, Japan, Kenya, South Korea, the US, the UK and Vietnam. Metlife Foundation and Gallup have generously made the data available and have invited the curious to explore.
This was not an invitation one could resist; what follows are highlights of findings from a more detailed treatment of the data here.
Three Reasons Why This Dataset is Great
I find datasets like this quite exciting. The primary reason is because it allows us to explore causal mechanisms that are taken as self-evident truths in public but that, in private, elicit some amount of soul-searching from practitioners. While these findings should surprise no one working in the field of financial inclusion, what this survey allows us to do is to get a sense of the magnitude of the correlation between, on the one hand, demographics, the extent of financial inclusion, relevant interaction effects and country effects, on the other, financial control and security measures.
The second reason is the additional levels of clarity this kind of analysis provides on top of what the survey firm reports. In Gallup’s summary document, they make the case that there is no clear relationship between average account ownership figures at the country level on one hand, and the reported degree of financial control and security (also at the country level) on the other. The analysis presented here adds color to that conclusion by noting that, while this finding is true, accounting for country-level diversity allows us to also see all kinds of patterns underneath where there is evidence of a clear connection between usage of formal financial services, and financial control and security.
The third reason is that it gives us cause to pause and ask if, and to what extent, it is time to move along the microcredit-to-microfinance-to-financial-inclusion progression that represents an evolution of approach around improving financial services and its impact for low-income individuals and communities. Financial health, as a measure of resilience to shocks and the ability to pursue one’s financial dreams, has come to be seen as a worthy successor to inclusion, for example. No doubt, many financial institutions could do a better job at tailoring products to needs so that so many accounts do not remain fallow. Some will even point out that the considering inclusion as a holy grail or panacea is the problem, and that it excludes other semi-formal or informal instruments.
Nevertheless, having had the opportunity to have gone through how individuals have used the tens of millions of accounts from about two dozen financial institutions over the years as part our work, I continue to be awed by the infinite creativity people bring to bear to even the most boring, vanilla bank account. While we should absolutely continue to pursue deliberate interventions to improve the financial wellbeing of low-income communities, this survey reminds us that even in the absence of that kind of effort, many are still able to achieve higher levels of financial control and health when simply presented with the tools to do so. In other words, if you build it, many will come.
Now, let’s dive into the details.
Demographic and Financial Inclusion Effects
There are certain expectations we have in terms of who would do better financially. We would expect older adults to be more in financial control, and those with bank accounts to feel greater financial security, right? Let’s look at how reported financial security and control varies by demographics, and extent of financial inclusion (Table 1).
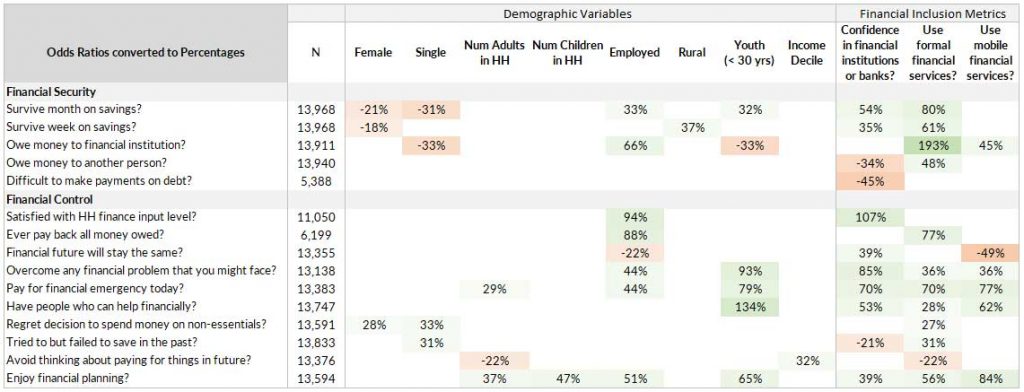
This table, as well as the ones that follow, converts the odds ratios obtained from logistic regressions and presents them as percentages that allow us to compare statistically significant, different responses across several categories within the same variable. Only covariates that are significant (at least 0.05 level) are shown.
As an example of what this table tells us, let’s look at the gender effect in detail. If they lost their income and had to rely solely on savings or things they could sell, women reported being 21 percent less likely to be able to cover expenses associated with basic needs for a month, and 18 percent less likely to do so if the period was a week. Women did not report owing money to a financial institution or person at a statistically significant different levels than men, nor did they find difficulty in servicing that debt. Women were also 28 percent more likely to regret the decision to spend money on something they didn’t need.
No statistically significant difference between men and women was seen in the other nine out of 10 financial control measures, such as satisfaction with the level of input into a household’s financial decisions, ability to pay for an emergency, ability to save in the past, and level of enjoyment in financial planning. Thus, there was some gender effect, in that women report negative results for three out of the fifteen measures, compared to men.
Employment had the most number of discernible effects. Compared to the unemployed, those who were employed were 33 percent more likely to survive a month on savings alone, 66 percent more likely to owe money to a financial institution, 94 percent more likely to be satisfied with their level of input in household decisions, 88 percent more likely to feel that they can pay back the money they owe, 44 percent more likely to be able to pay for an emergency, 51 percent more likely to enjoy financial planning, and 22 percent less likely to feel that their future will not change for the better.
Note that this included those who have a job or who are self-employed and those who report being unemployed. Because gainful employment is seen as one of the key drivers of financial wellbeing and upward economic mobility, being able to disentangle the impact of different types and different degrees of employment would be informative.
Sometimes, the absence of evidence is also instructive. For example, there was no difference between urban and rural respondents except for a 37 percent greater likelihood for rural respondents to be able to last for a week on savings. If the reported levels of financial security and control are similar, does this suggest that the more informal financial instruments prevalent in rural areas are enough to support similar level of financial well-being, or is that “just” the perception and not reality?
We leave it to the reader to explore the other demographic effects for now, with the note that there is a lot more to unpack here.
Now, let’s look at the financial inclusion metrics, which are the rightmost three columns in Table 1. There was a strong correlation between the use of formal financial services (and the confidence in them) and reported levels of financial control and security. Positive effects included 80 percent greater likelihood to survive for at least a month on savings, 77 percent greater likelihood to repay all debts, 70 percent greater likelihood to be able to pay for an emergency and 56 percent higher likelihood of enjoying financial planning. Negative effects included 27 percent greater likelihood to regret a decision to spend money on things they don’t need and 31 percent greater likelihood of having tried to save in the past, but failing.
This is where we must make the “correlation does not equal causation” disclaimer. While one could make the case that greater levels of financial inclusion contributes to greater levels of financial control and security, there is an existing recognition of inclusion being a pseudo-necessary but not-nearly-sufficient requisite for financial health.
Some might also argue that people are tapping into the formal financial system because they have sufficient funds to spare; after all, not having enough money was listed as one of the key reasons for not opening a bank account by two-thirds of Findex respondents.
Interaction Effects Between Demographic and Financial Inclusion
Interaction effects are of great interest because they help us determine if two or more covariates operate together in such a way that, together, they have some effect that is above and beyond what their individual effects are. For example, we saw earlier how employment and usage of formal services is associated with higher levels of financial control and security. Exploring interaction effects allows us to ask if the effect of someone who is employed and uses formal financial services is more than the effect of just being employed, irrespective of whether they use formal financial services or not, plus just using formal financial services, irrespective of whether they are employed or not.

Turns out, there is a strong interaction effect between employment and financial inclusion (Table 2). Those who were employed and had used mobile financial services were 41 percent more likely to survive for a month on savings, compared to those who were not employed or who did not use mobile financial services, or both. This 41 percent is over and above the 33 percent greater likelihood from employment alone, suggesting a rather strong employment-based interaction effect.
We also saw widespread interaction effects around youth, defined as those who are less than 30 years of age, and rural residents. There was little interaction effect around gender and marital status.
Country Effects
If there was any doubt in anyone’s mind, the country effects from the Gallup date point out the obvious; countries are different. The logistic regression runs in Stata assigned Vietnam as the reference, which means that all values were relative to the responses from Vietnamese respondents. Even though the absolute numbers were relative to Vietnam, we could still explore other country pairings by comparing their relative effect levels.
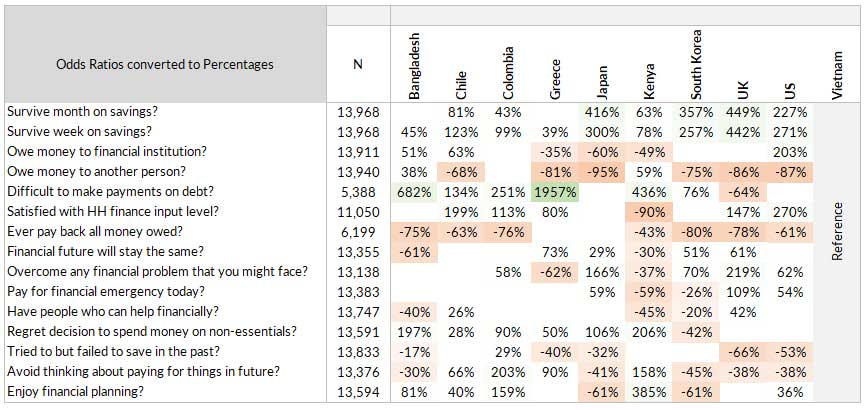
Here is a selection of some interesting country level effects:
- Bangladesh, Greece and Vietnam were at similar levels when considering a month’s worth of expenses, while Vietnam had the lowest levels when looking at one week. (Note that lack of percentages suggests effects statistically indistinguishable from Vietnam.)
- The Japanese had the lowest likelihood of owing money to both an institution and an individual. Greece also had quite low levels of reported indebtedness, but were twenty times more likely to find it difficult to make debt payments, compared to Vietnam. The US had the highest levels of indebtedness amongst the 10 countries.
- Kenyans were least likely to be satisfied with the level of input to household financial decisions, to be able to pay for a financial emergency today, and to have people who can help financially, while Bangladeshis were most likely to expect a positive change in their financial futures.
- Overall, the advanced economies of Japan, South Korea, the UK and the US have similar profiles for financial control and security measures.
While the Gallup data does not have enough country level metrics to explore what might explain some of these rather large variations, there are many datasets out there which one could stitch to attempt to identify some national and sub-nationally relevant indicators.
Overall, this MetLife Foundation-funded Gallup survey illustrates the correlation between financial control and security on one hand, and financial inclusion on the other, and how it varies depending on demographic characteristics. This post is just scratching the surface of the wealth of information that is contained in this dataset though, and we plan on taking deeper dives into particular variables and particular countries to explore specific themes of interest. Watch this space for more updates in the near future!
Special thanks to Damian Milverton and Rasima Swarup for their help in pulling this piece together.
Postscript
July 27, 2018
We would like to clarify that we have used a different definition of the “financial security,” “financial control” and “financial inclusion” variables compared to how Gallup has defined them in their results. These differences are noted below; for details, please refer to the Gallup Global Financial Health Survey webpage. Any definitions attributed to Gallup below are quoted from the document titled Gallup_Global_Financial_Health_Study_Methodology_Report.pdf.
Financial Security
How Gallup Defines It]
Financial Security can take one of three categories: “Financially Insecure,” “Financially Stretched” and “Financially Secure” based on five questions. The three levels are obtained thus:
- Financially Insecure: Respondents who said they had less than a month of savings or assets OR said their debt made it “very difficult” to pay for other things.
- Financially Stretched: Neither Insecure nor Secure.
- Financially Secure: Respondents who said they had more than six months of savings and, if they have debt, paying back that debt is “not at all difficult”.
How BFA used this data in our analysi
We took each of the five questions separately, looked at them as variables of interest and labelled each of them as financial security variables. We did not use the three-level Financial Security variable or create another composite variable.
Financial Control
How Gallup Defines It
Respondents are marked as having a high level of financial control if they respond positively to 8–10 of the questions, and marked as not having a high level of financial control if they respond to fewer than 8 questions positively.
How BFA used this data in our analysis
BFA took the results of each of the ten questions separately, looked at them separately and labelled each of them as financial control variables. BFA did not use the same notion of high levels of financial control as defined by Gallup or create another composite variable.
Financial Inclusion
How Gallup Defines It
Gallup uses the same definition used in the World Bank’s Global Findex for financial inclusion and includes it as a secondary data indicator.
How BFA used this variable in our analysis
BFA used three questions from the survey that were indicative of inclusion (Q23, Q25 and Q19).