Three findings from the application of a financial health index in Vietnam

This blog post illustrates how to use financial health data to analyze social impact, in the final post of a three-part series. The first post discusses the business context of financial health at Capital Aid for Employment of the Poor Microfinance Institution (CEP) in Vietnam; and the second post documents the construction of the financial health index. With a financial health index, CEP now has data that will illuminate the interplay between poverty and financial health, the role of household structure in determining financial health, and the impact of its services on wellbeing.
Here, we present three of the more informative findings from a three-month study of financial health in southern Vietnam from September to November 2022, with 973 customers of CEP. We explored the following questions:
- How strong is the correlation between financial health and poverty?
- Do customers of different household sizes have different determinants of financial health?
- Can financial access mitigate declining financial health of older customers?
Let’s briefly recap the financial health measure that we described in detail in the second post of this blog series [link to blog]. For this project, financial health is measured with an index that BFA Global and CEP developed in 2021. The financial health index is a single number, between 0 and 10, based on a survey module of 14 multiple-choice questions. The questions pertain to four aspects of financial health that are widely accepted in some form and that BFA refers to as day-to-day management, opportunities, resilience, and agency (DORA). The scoring algorithm uses a latent variables approach to measure the four components of financial health, which was calibrated based on a survey of CEP customers in 2021. Each customer’s responses are converted into a financial health score that falls between 0 and 10. This post demonstrates how the data can be used to serve low-income customers better.
Financial health and poverty
Determining the correlation between financial health and poverty was necessary for both theoretical and practical reasons. Theoretically, it is reasonable to expect financial health to be correlated with poverty levels, as poverty is intrinsically related to the ability to meet financial obligations and achieve financial goals — core concepts within financial health. Practically, CEP has used poverty scores as the core metric to determine the financial wellbeing of their customers thus far, and financial health measures would have to demonstrate utility above and beyond the value CEP was deriving from the poverty scores.
We find that financial health is indeed correlated with poverty levels, but there are variations such that within each level of poverty measured by CEP, we observe variations in financial health (Figure 1). This confirms that the financial health questionnaire is neither random (uncorrelated with poverty) nor simply a reflection of poverty status. Among poor customers, there are some who score above the average for financial health (5.6); and among those who are not poor, there are some who score below the average.
Figure 1. Poverty vs. financial health
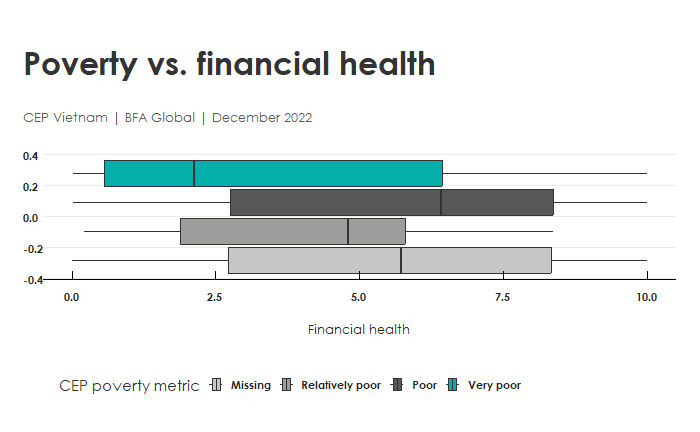
On average, financial health was 2 points lower for those in the poorest category than the rest of customers, using CEP’s preferred metric. The correlation is highly statistically significant. Yet, when we look at the boxplots, we see substantial variation in financial health at each level of poverty. Among the very poor group, 30% of respondents reported above-average financial health. This tells us that individuals could be struggling with some aspect of their financial wellbeing that is lost when we look at poverty alone.
Financial health and household size
Next, we turn to household structure. The survey dataset had the following metrics for household structure: the number of individuals; the number of working individuals; and the number of dependents. In addition, we have poverty metrics as described above, age, gender, and loan balances.
Figure 2. Household size mediates the correlation of loan balances and financial health.
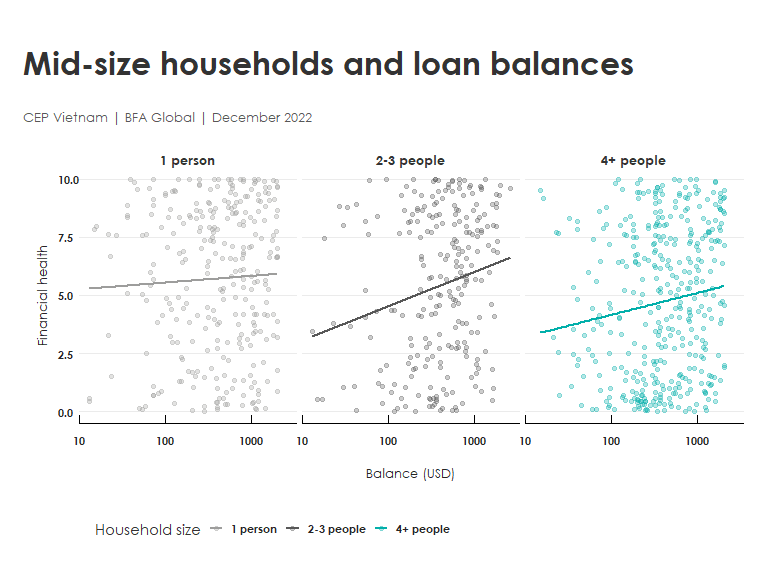
Household size is associated with a striking pattern in financial health (Figure 2). Loan balances are correlated with an increase in financial health, but the correlation is not the same for everyone:
- The correlation of financial health with loan balances is greater for households of size 2-3 than for households of one individual
- On average, the smallest households have the best financial health
- Midsize households (2-3) fall in between those with one individual and larger households
When we examine the correlation between financial health and how much money has been borrowed, the midsize households have a much greater correlation of loan size and financial health. As loans increase by USD1,000, a midsize household will see a greater increase in financial health (1.1 points) than a person living alone. Larger loans help financial health; but the relationship is the most pronounced for mid-size households.
We must be a bit cautious about how to interpret these findings. Because the data are collected at a single point in time, we do not know whether it is financial health that leads to larger loans, or vice versa. It is also possible, even likely, that a third, omitted variable is behind this apparent correlation. A larger dataset with more explanatory variables would be necessary to investigate the nature of this missing variable.
Financial health and age of customer
Our third finding concerns how financial health changes over the customer’s lifetime. As some pass from middle age into their senior years, they will have land to rent or a business interest that provides income. Others will have family to care for them. But for those that do not, there is a great risk that their income will decline beyond a certain age. For that reason, we wanted to study how financial health changes with customers’ age at CEP, particularly because their customers tend to be older (median age 45) than the general population of Vietnam (median age 32).
We found that the financial health of current customers does not change with age, although among new customers financial health declines (Figure 3). That is, a first-time borrower under the age of 40 has higher average financial health than a first-time borrower over 50. The size of the correlation is about one point on the financial health index per 25 years. Yet among those who have previously been customers of CEP, there is no correlation. There is effectively no decline in financial health with age among returning customers.
Figure 3. Financial health scores diverge with age for new and returning borrowers.
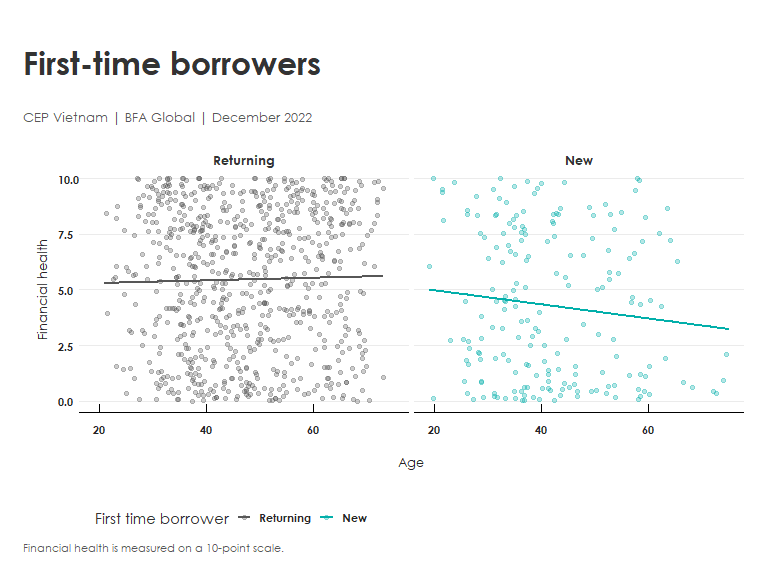
Additional research is required to determine why returning borrowers retain their financial health with age. One clue is that returning borrowers have higher financial health scores (average 5.4) than new borrowers (average 4.2). It is not clear whether customers are more likely to retain financial health by virtue of being CEP customers, or whether financially healthy people are more likely to remain CEP customers. Or both, creating a positive feedback loop. Or, again, that something else is driving the correlation. What this tells us, however, is powerful: returning CEP customers are more likely to retain good financial health over the years than the new customers, a finding that is worthy of further study.
This post has explained three findings made possible by our new financial health index in Vietnam. To recap: poor borrowers can manage to build financial health despite their modest means. Second, larger loans are most clearly associated with higher financial health among mid-size households (2-3 individuals). And third, first-time borrowers at CEP have lower financial health, the older they are; but the same is not true of returning CEP customers. By segmenting customer populations and studying the dynamics of financial health over time, CEP can continue to study the impact of its products on the population it serves and use that knowledge to improve its offerings.
This work was conducted through the VietFHI project and was made possible through generous funding and support from MetLife Foundation and Rockefeller Philanthropy Advisors.