Building a customized financial health index: DORA for Vietnam

BFA Global partnered with Capital Aid for Employment of the Poor Microfinance Institution (CEP) in Vietnam to measure and improve the Financial Health of CEP customers. Developing a scalable and actionable index for financial health was a key requirement for the project. In this second blog post of a three-part series, we share the story of our collaboration and how we built that metric. CEP rigorously measures the poverty status and financial condition of its customers. The financial health index focuses on the financial aspects of customers’ wellbeing and opens the doors to new possibilities.
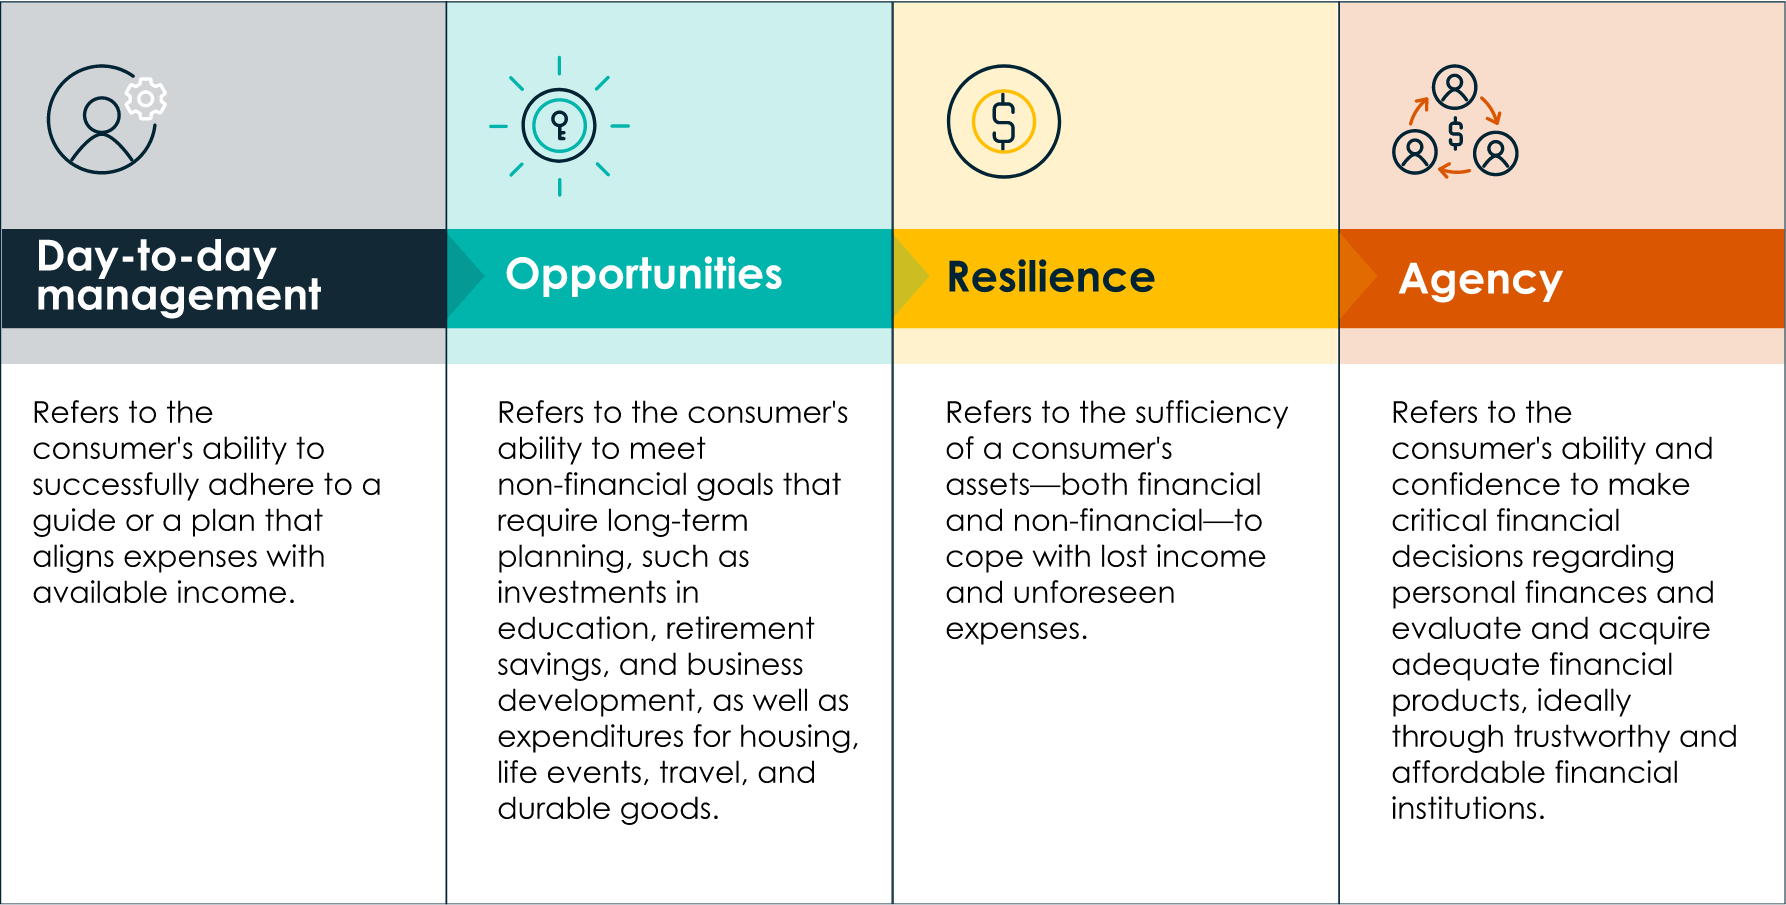
At the core of the measure is a financial health index that is composed of four interlocking dimensions: Day-to-day management, Opportunities, Resilience, and Agency, or DORA (Table 1). BFA Global developed this framework over the years through rigorous action research across the globe. Financial health helps practitioners understand whether efforts to improve financial inclusion and financial literacy have been successful, where the measure of success is discernible improvements to an individual’s financial wellbeing. This approach is also consistent with the definition adopted by the United Nations, where financial health is seen as the ability to “smoothly manage their current financial obligations and have confidence in their financial future.”1 UNSGSA. Measuring Financial Health. 2021. https://www.unsgsa.org/sites/default/files/resources-files/2021-11/Measuring-Financial-Health-note-v2.pdf (Disclosure: the author is a member of the working group that endorsed that definition.)
Table 1. DORA, our approach to financial health.
BFA Global customized a financial health questionnaire to fit CEP’s customer population. We did this through extensive pilot testing, selecting questions from a larger list that have been used to measure the financial health and/or wellbeing around the globe. Some simple concepts were deceptively difficult to translate into intuitive languages, such as “a household budget.” Similar problems afflicted our attempts to translate units of time, such as “a few weeks” or “a few months.” A language that referred to the income and expenses that one can normally expect in a month was problematic. CEP has a hugely diverse population of customers, some of whom have very little formal education and financial literacy; and some have extremely volatile and unpredictable income from self-employment. We needed a questionnaire that could be understood by all of them.
Table 2. Examples of financial health questions
| Day-to-day | When you think about the money you need during a typical day, do you have enough to cover your basic needs for that day? |
| Opportunities | To what extent does this statement describe you? “I am concerned that the money I have or save won’t last.” |
| Resilience | To what extent does this statement describe you? “I could handle a major, unexpected expense.” |
| Agency | In the last one year, has your financial situation caused you stress? |
With the data from our calibration survey, we used factor analysis to establish correlations between the questions and the four aspects of financial health, DORA. Factor analysis is a technique that allows one to take a set of observed variables – in this case, the administered questions – and map them to a smaller set of underlying “latent variables” that drive the responses we see. In this case, these four dimensions of financial health are the latent variables.
Weights are assigned to each question that reflect their correlation to the latent variable, and those weights provide the basis for a financial health score. When a customer completes the questionnaire, the new answers are multiplied by the weights from the factor analysis, and then rescaled so that the result falls on a scale from 0 to 10. Each individual’s financial health is scored on a 10-point scale, but the score itself is more representative of the underlying population and reflective of the relative importance of each question.
This scoring approach entails tradeoffs. It tends to favor accuracy over explainability. The scores are derived from a rigorous statistical algorithm, which gives us confidence that the weights better reflect the experience of customers and their financial health. One alternative, widely used elsewhere, is to assume that all the questions should have equal weight toward financial health. This seems to be a strong assumption and also uninformative. Another alternative is to ask experts to assign point-values to each response. That approach can work well for indicators of good financial behavior — where the questionnaire essentially tracks how well respondents are following best practices. But that does not ensure that it will predict whether respondents can meet their financial obligations and goals successfully.
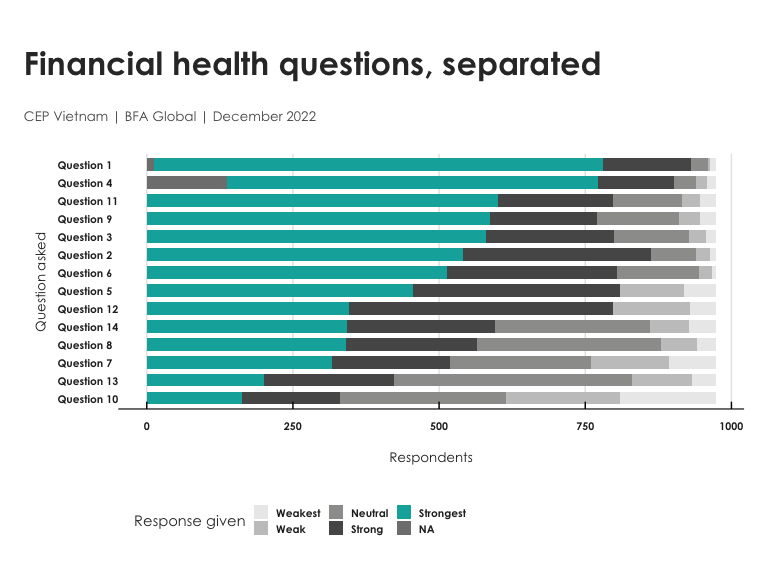
We can see from the survey data that they are not all equally likely to be answered with similar distributions of choice. Some questions are far more likely than others to elicit responses at the extreme, while others see more tepid agreement or disagreement. Our scorecard leverages the correlation of responses to model what the correct point values for each question should be to reflect this difference in distribution.
Figure 1. The distribution of responses to individual questions.
Now that the model has been fit, we can also extend and update the model as we learn more about financial health. In principle, the financial health scorecard can be built into any app, any spreadsheet, or any API. CEP built this version of the financial health scorecard into their digital app. When customers open the digital app and fill out the financial health questionnaire, they get a single number back right away. And if the scorecard is updated at some point in the future, we can update the scorecard inside the app and push out the update to all customers.
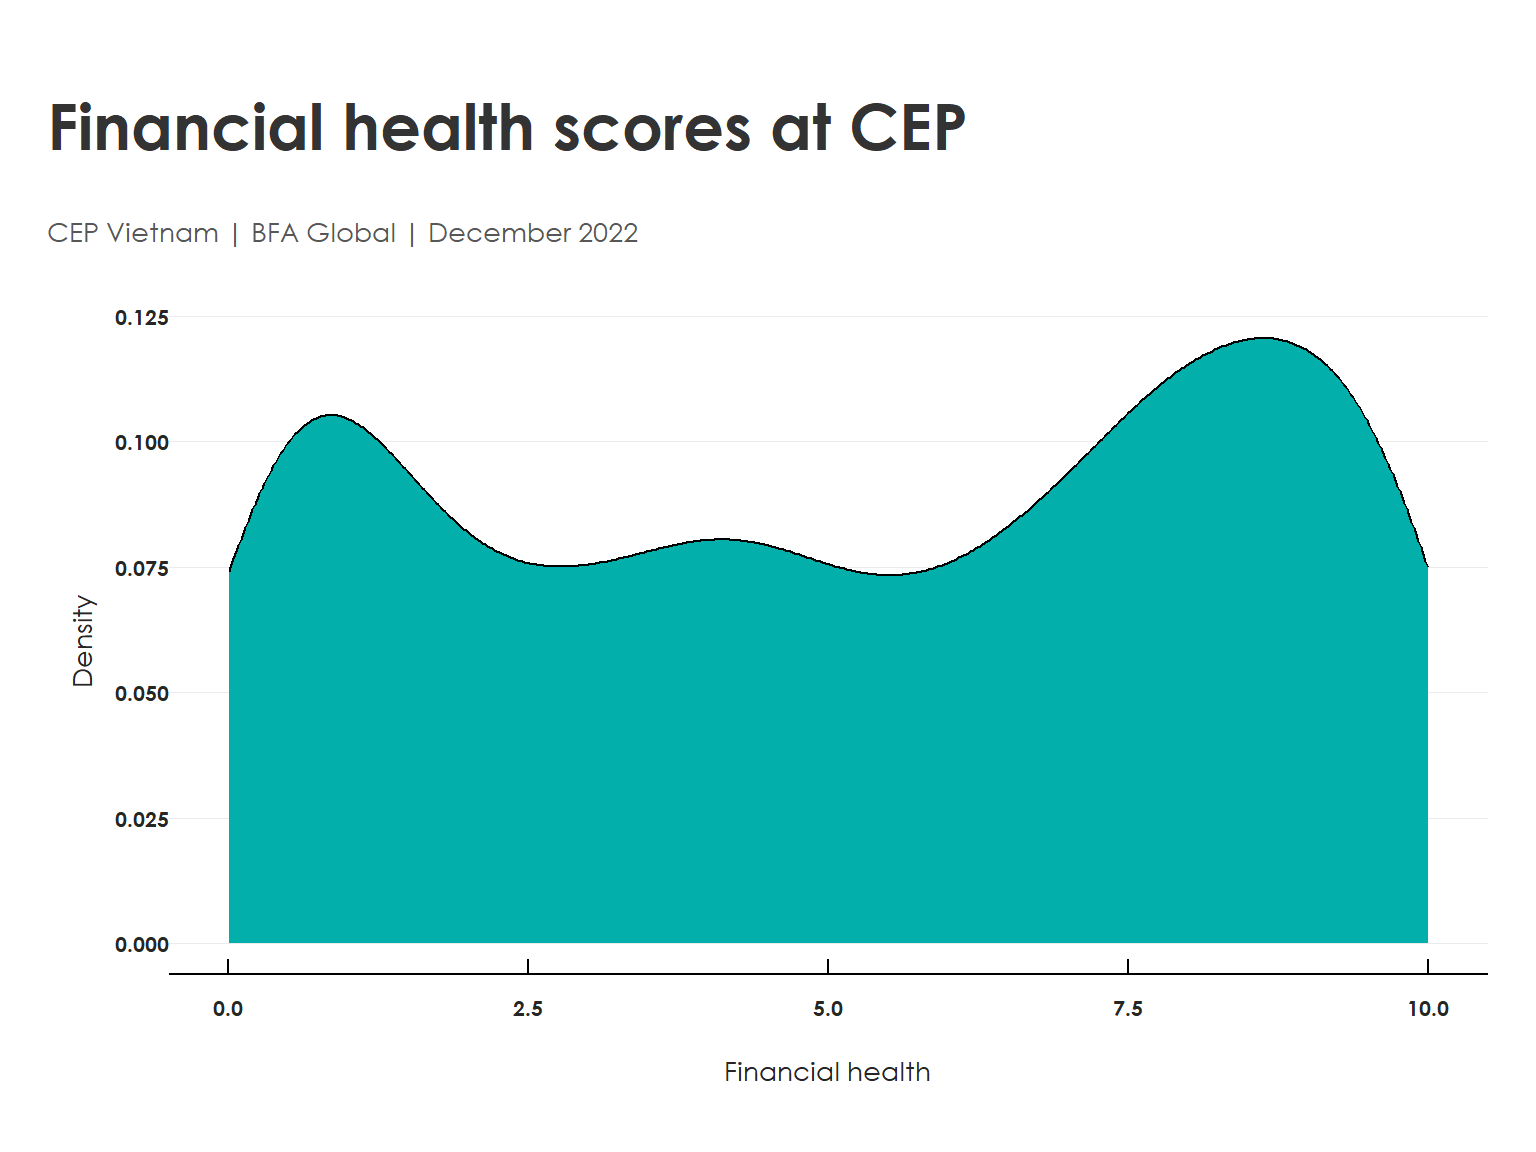
In Q4 2022, CEP collected data from 973 customers on their financial health using this framework. The resulting distribution of FH scores is presented in Fig 1. The median financial health score was 5.4, with the highest score a perfect 10 and the 75th percentile at 8.2. There is also cause for concern, with 25 percent of the customers scoring below 2.2. Although it may seem unusual to see the two peaks in this distribution, there is a good reason for this. CEP made a point of oversampling its poorest customers in the sample for this survey. The result of sampling two customer segments — the typical customers and the poorest customers — was a distribution with two peaks in it. [Read more about that in blog post 3.]
Figure 2. Distribution of financial health scores (densityplot)
We can extend this work to include a number of applications and features on the roadmap going forward. The most-requested feature is a better diagnostic to assess what customers need. We have an early version of a financial-health diagnostic that does just that.
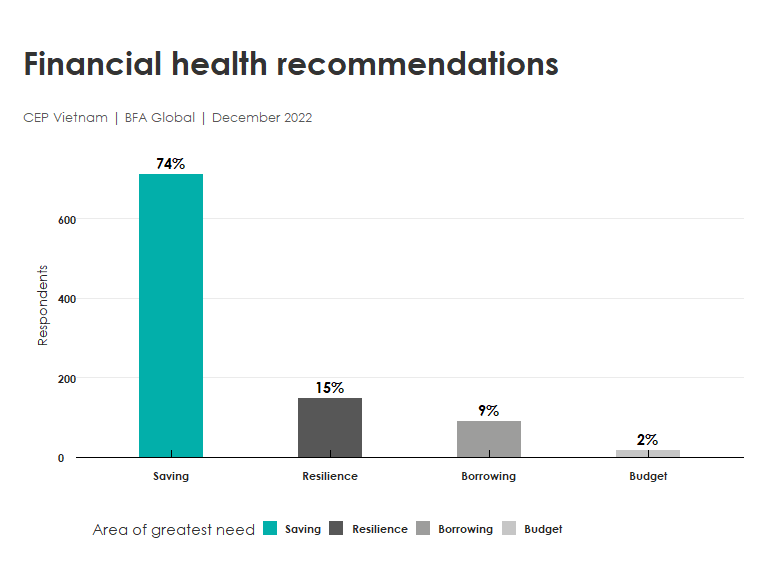
By dividing up the financial health questionnaire into sub-scores for the four components of DORA, we can calculate a simple percentage of the available points in each component for each customer. This is the less-informative approach we described earlier. Effectively it assumes that (1) all the questions about day-to-day finances are only related to one another, and (2) they are equally important to that outcome. When we calculate sub-scores for DORA in that manner, we can immediately provide the rank-ordering of each customer’s needs. The area where customers are least likely to feel secure is in their saving to meet future financial goals. Three in four customers gave responses indicating they had difficulty preparing for predictable needs: a new vehicle, seasonal expenses for tuition or holidays, and investments to sustain them in old age.
Figure 3. Financial health diagnostic: the areas of greatest need
This is an area of continuing research, where BFA Global will continue to refine insights and where CEP will share its lessons learned from the field. In future research, BFA would want to compare these recommendations by comparing the underlying data with the advice of experienced loan officers. The algorithms can learn from the time-tested insights and judgment of professional loan officers. And the algorithms, as they improve, can provide decision support.
This work was conducted through the VietFHI project, and was made possible through generous funding and support from MetLife Foundation and Rockefeller Philanthropy Advisors.