Bringing it home: understanding problems hindering fintech lending for SMEs in South Africa today
Blog 6 of the Recovtech series, this post written in partnership with members of the South Africa Recovtech team.
Blog 4 in this Recovtech series has made the case that, in the economic recovery phase that started as COVID restrictions were lifted, fintech innovation has a potentially crucial role to play through enhancing the supply of financing to MSEs. Drawing on examples from the largest fintech markets in the world, the US and China, blog 5 made the case that fintech and BigTech companies can bring innovative approaches to financing to the table. In this blog, the final in this Recovtech series, we look more closely at the problems that limit the flow of financing to MSEs in South Africa.
For a long time, small and medium enterprises (SMEs) surveyed in World Bank Small Business Surveys across emerging markets have consistently reported that lack of access to finance is their biggest single barrier. This general perception is the outward manifestation of many underlying problems, including small firms’ lack of capacity to manage growth or face large risks, or to comply with onerous regulations: it is certainly not at all as simple as asserting that banks are unable or unwilling to finance this sector. Over the years, various committees and research projects in South Africa have considered aspects of this issue. But how do we start to identify and prioritize the aspects of SME financing that are most susceptible to fintech innovation in the next five years?
We describe here a three-step process.
1. Differentiating sectors and segments
The term MSE, or its relative ‘SME’, is a very broad one covering entities of different ages, stages and propositions for growth, that engage in economic activity across all sectors of the economy. Since our primary concern in the Recovtech project is about inclusive growth – that is, growth that leads to improved opportunities for the bottom 40% or more of the income spectrum – small business activity would likely be more inclusive in some sectors rather than others.
The sectoral propensity for inclusive growth can be assessed and ranked using a range of measures like employment multipliers and domestic value add, weighted by sectoral size. Measures like these can at least direct attention to the sectors with highest social return from growth. Usually, sectors such as agro processing, construction, and wholesale/retail come out with a higher propensity for low-skilled employment than sectors like heavy manufacturing or ICT.
However, the economic challenges brought on by COVID-19 have dramatically changed the short-run prospects of many sectors and even-long run prospects of some. For example, sectors like international business travel and tourism have suffered long-term damage as underlying demand patterns have shifted. Other firms, for example in the e-commerce sector, may have seen significant acceleration in their growth and face brighter prospects in the long run than before. Many sectors lie in between these extremes and will recover at different rates.
Payment companies like Yoco in South Africa have been able to track and report aggregated revenue patterns across the segments of their many SMEs clients and have published this data in an effort to provide information to the market as a whole. However, to create a balanced national picture, individual small acquirer datasets need to be pieced together to form a reliable dashboard that displays how sectoral prospects are changing. The US Bureau of Economic Analysis has reported on how it has used card data to assess the impact of COVID across sectors, through its ability to obtain data from one of the largest acquirers, which has merchants across all the main payment networks.
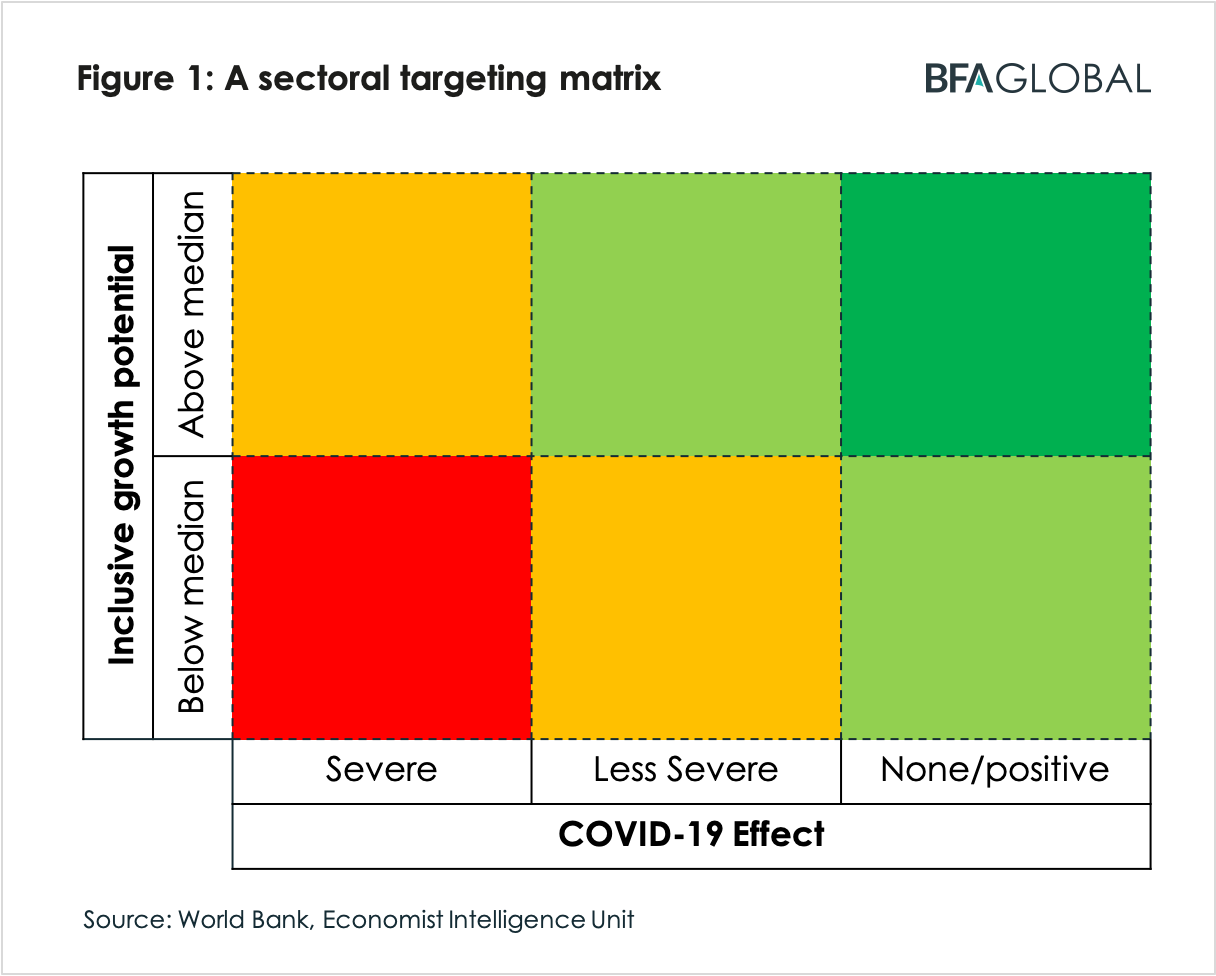
In principle, a dashboard could be created (by Stats SA for example) that differentiates sectors by both their inclusive growth potential and their apparent COVID impact. The outcome could be summarized in a simple diagram, such as the one shown in Figure 1 below, where the colors differentiate the sectoral lending prospects in the different zones. The dark green box in the top right corner contains the sectors with the highest social return post-. Recovtech participants in South Africa suggested that small and emerging farmers in the agriculture sector belonged in this zone. Conversely, sectors found to be the red zone need to be treated with more caution: not only is the social return lower (below the median in this picture) but the COVID effect may necessitate restructuring, and as a result it may take longer before growth can resume. And sectors in other zones lie in between in terms of prioritization and risk profile.
At present, we understand that the data has not yet been collated and published in a form that could enable an authoritative dashboard to be created and regularly refreshed in South Africa. If a credible research center in South Africa undertook the collection and analysis that would allow a sectoral dashboard like this to be published on an ongoing basis, disaggregated even to regional levels, this could help inform lending decisions by private and public sector alike.
2. Understanding the range of issues
Even for a prioritized sector (in the green zone above, say), further research would still be needed to get a clear handle on the constraints facing small businesses in that sector. As an example of this, FinMark Trust recently published a comprehensive report on access to finance for small and medium commercial farmers and micro businesses in South Africa. This report builds on a range of other work assessing the constraints faced by small farmers, such as the Competition Commission’s 2019 report on barriers to entry for smallholder agriculture.
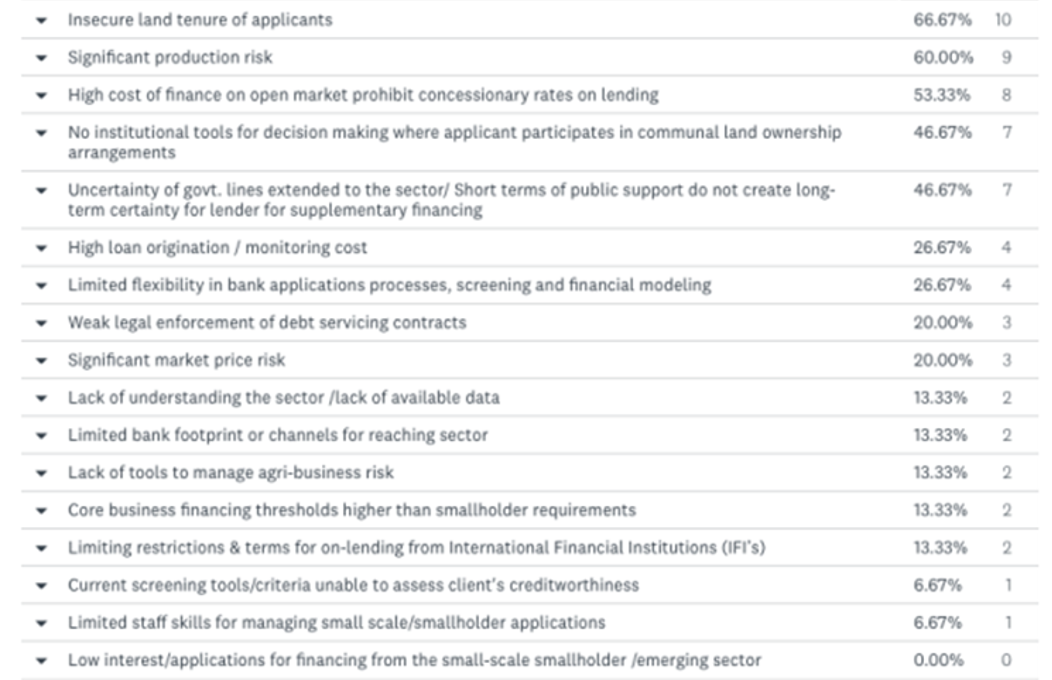
The FinMark report involved surveys with a range of active providers of agricultural finance to Small and Medium Farmers (SMFs). Figure 2 below extracts the table ranking the constraints listed by respondents based on the number of mentions. It is striking that, of 17 factors shown, the top five have little or nothing to do with fintech innovation: these are reasons like insecure land tenure, production risk, communal land ownership, uncertainty and tenor of government support, and they must be resolved outside of fintech innovation. Only from the sixth-ranked problem (high loan origination costs) downwards do the constraints start to become more amenable to fintech innovation, especially those which list lack of flexibility in existing lending processes, price risks (which may require blending insurance to mitigate), lack of data or understanding by lenders and limited footprint or channels.
Other demand-side initiatives under consideration include support for delivery of business education, in particular around digitization.
Figure 2: Factors constraining agricultural access to financing
Using this one recent sectoral review as an example of the general case, it is important to be realistic about the limits of what fintech innovation can achieve in unlocking growth in any particular sector. Other types of innovations may also be required some of which public-private innovation may address. For example, the working group on SME issues convened by the South African National Treasury has recommended the establishment of a movable collateral register. An innovation like this could help small businesses access financing for equipment and even for livestock in farming.
3. Supply side issues: banks and fintech lenders
The FinMark Trust report states that “Fintech can be a disruptor in existing well established financial markets yet no evidence came to light during the research to indicate that this was the case in financial markets serving SMFs or SMEs….[no lenders] reported having innovative integrated technological service delivery systems customised to SMF needs. This remains a gap in the market.” (p.74) The report in fact shows that the bulk of formal lending to the SMF sector comes from development finance institutions and from commercial banks, with only a very small share provided by non bank lenders.
This sectoral view mirrors the more general picture of SME finance. Bank returns to the SA Reserve Bank show that banks’ combined exposure to the SME Retail Sector stood at some ZAR228 billion by the end of 2018. This is many times larger than the credit extended to this sector by non-banks: the 2019 Fintech Scoping Report estimated that fintech companies provided only 1.49% of credit to SMEs and households. However, while the largest source today, bank credit to SMEs has declined as a proportion of total credit during the past ten years. This decline does not in itself suggest that banks are unwilling to lend to SMEs, although it does suggest that the SME sector is perceived to be less attractive to banks than other sectors where relative exposure has risen, such as corporate or mortgages. In contrast, it seems likely that total non-bank lending, while small today, is increasing at rapid rates, although accurate sectoral aggregates over time are harder to come by since the non-bank sector is not subject to the same level of reporting.
Participants in the Recovtech process discussed potential reasons banks may be slow to lend to SMEs, even if they have the risk appetite to do so. Heavy weight was placed on banks’ inflexible processes and inability to collect and use appropriate alternative information sources to reach good underwriting decisions in a time and cost effective manner. Participants recognized that new forms of relationships between banks and non-banks were starting to emerge in this sector in SA, mirroring developments elsewhere. These relationships range from wholesale bank lending to non-bank lenders, to testing new forms of credit scoring or buying loans originated by them. Ultimately, banks in SA may use their financial muscle to buy out successful fintech lenders, as has happened recently with several large takeovers in the US.
Even if that is one eventual outcome, Recovtech participants placed more focus on understanding the problems that constrained the flow of non-bank fintech lending to SMEs. Within the broad category of SMEs, there was a need to focus on the smaller emerging segment that was most underserved, compared with larger or more established businesses that banks may be better placed to pick up. Based on their practical experience in the market, members of the group contributed insights that helped to build up a “problem tree” depicting the interlinked problems and enabling them to be disaggregated. The group considered both demand and supply side constraints. Figure 3 below shows the supply side branches only of the problem tree, explaining through several levels why fintech lending is constrained. The problem tree quickly sprawls to display a wide canopy!
Figure 3: The fintech lending ‘problem tree’ in SA
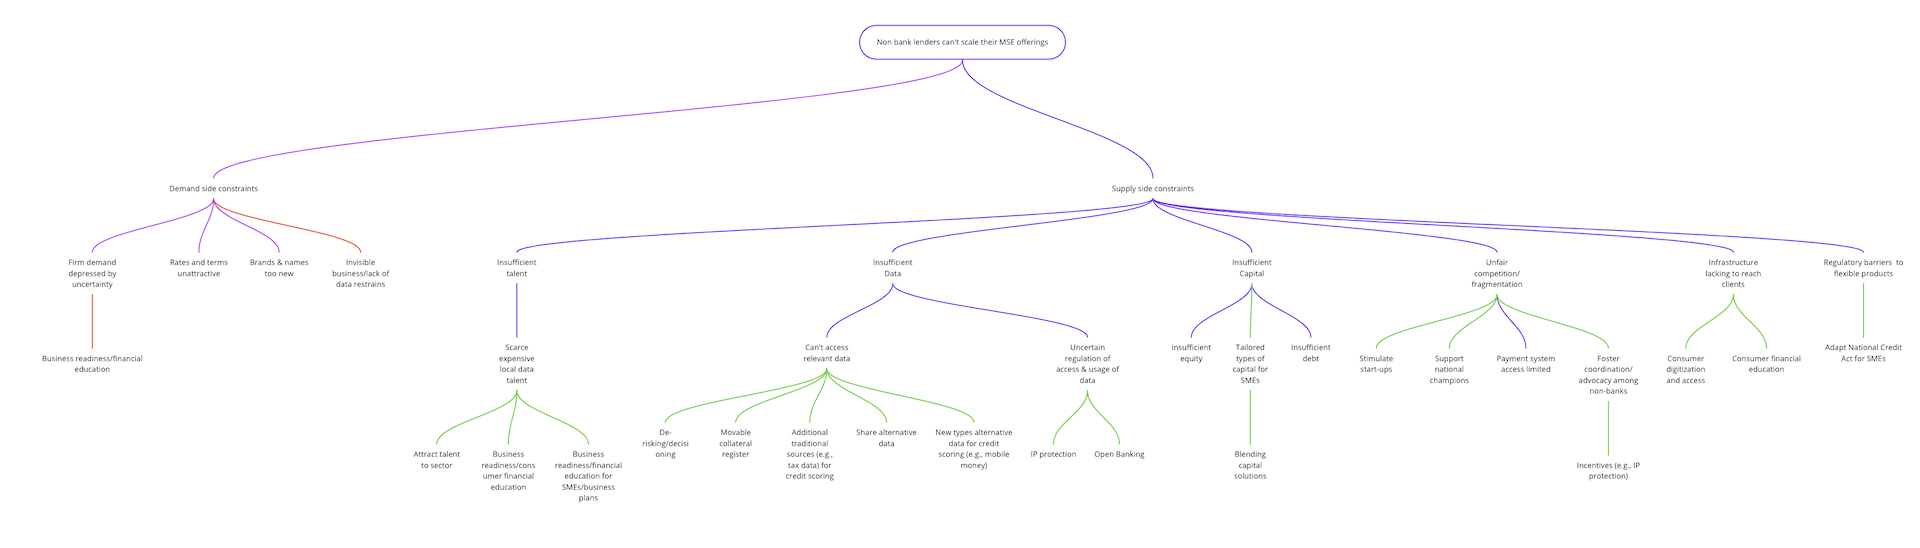
Source: Recovtech project group (follow this Miro link to access the mind map)
The main ‘branches’ identified on the supply side were:
- The lack of digital channels to reach customers cost effectively
- Regulatory barriers associated with the National Credit Act that constrained product flexibility e.g. on repayment terms; or with the payment system e.g. the design of the Debicheck debit order.
- A shortage of talent to recruit, especially with constrained finance
- A shortage of alternative data, and some uncertainties over how data can be shared within the context of lending marketplaces.
- Difficulty of blending private finance easily with available lending schemes
- Shortage of onlending capital: this was not an immediate problem for lenders represented but could be a problem as the sector grows
The Recovtech participants discussed how it was hard for the emerging group of fintech lenders to find an appropriate voice so that they could be consulted and considered in issues of national policy, as the organized incumbent sector is. For example, unlike the experience in the US described in blog 5, fintech lenders in SA had not been invited to participate in loan guarantee schemes provided by the National Treasury to mitigate the effects of COVID on small businesses.
On to TechSprints in 2021
These problem statements coming out of the South Africa process so far will need to be consolidated with those coming from the other Recovtech countries in the coming months, to form a cross-country view. Then, as managers of the project, BFA Global will screen the potential problem areas to find those most tractable for the two cross-country TechSprints, which will be held in the first quarter of next year. In these sprints, a public private collaboration will come up with prototype solutions for one or more specific problem statements, informed by the use of relevant data sets.